Surprising outperformance from some beaten-down stocks and ETFs has been a top story for early 2012, writes Moby Waller, and three distinct sectors now play home to the most compelling trade ideas.
It’s only been a brief amount of time since the calendar turned over, but there are some interesting names leading the performance of individual stocks in 2012.
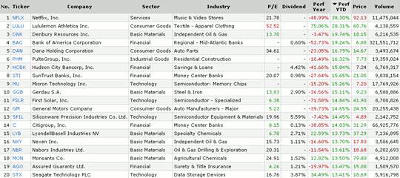
We screened for “optionable” stocks with over two million in average daily volume and $2 billion market cap, then sorted by year-to-date performance.
Take a look at the top 20 names in the table below:
The first thing that jumps out is how many big losers on a 52-week basis are having rebounds. Only four of the 20 names rallying the most in 2012 are up over the previous 52 weeks. Netflix (NFLX) leads that list with a gain of 38% this year while still down 49% over the past year.
Other big, well-known names popping up include Bank of America (BAC), PulteGroup (PHM), Micron Technology (MU), First Solar (FSLR), General Motors (GM), Citigroup (C), Monsanto (MON), and Seagate Technology (STX).
There is significant sector representation on the list by the financial (including several banks), technology (semiconductors showing up prominently), and basic material sectors. Let’s examine those sectors through the most appropriate ETFs representing each group and see what the charts show.
All of these ETFs are somewhat forming the "wedge" (sideways triangle) formations that, as discussed previously, have formed in many major indices and sectors. These kinds of narrowing formations tend to precede a major move, and in the current scenario, it looks like this will be to the upside.
We’ll use the Select Sector SPDR - Financials (XLF) for the financial group, although there are also banking and other sub-group ETFs that are worth looking at for comparison, such as the Market Vectors Bank and Brokerage ETF (RKH), SPDR KBW Regional Banking ETF (KRE), SPDR KBW Bank ETF (KBE), and SPDR KBW Insurance ETF (KIE).
See related: Stay off the Regional Bank Bandwagon
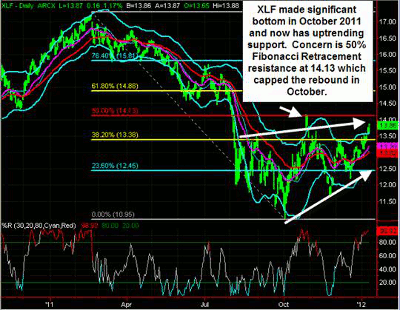
Here is an XLF daily chart:
You can see in the chart above the sharp downtrend in financials during most of 2011, with Percent R (%R) remaining below mid-levels from basically February to October 2011. It looks like an important bottom was made in October (as many sectors/stocks/indices did). The up-trending higher lows trend line should now provide support on pullbacks. There is an up-trending overhead trend line that could provide resistance a bit above current levels.
Also, with such a clear top and bottom in 2011, it’s prudent to look at Fibonacci retracement of the move, which points to the $14.13 level as a 50% retracement of the highs. Note that the ETF failed right around this level in late October.
The next retracement level above 50% is just below the $15 level (this particular ETF is low priced and doesn’t move a great amount sometimes).
NEXT: Semiconductors Begin to Heat Up
|pagebreak|Next, for technology, we will look at the Market Vectors Semiconductor ETF (SMH), the Select Sector SPDR - Technology (XLK), and PowerShares QQQ Trust (QQQ), which are good proxies for tech stocks.
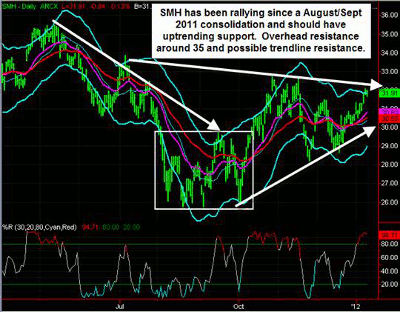
Here is an SMH daily chart:
SMH had a sideways consolidation in August/September 2011 where it halted the downtrend. Since then, it’s making a nice pattern of higher lows, which should provide support on pullbacks. There is also a potential overhead resistance line right around current levels, and a break above that makes a run to $35 look likely.
For materials, let’s take a look at the iShares DJ US Basic Materials Index Fund (IYM), with the Select Sector SPDR - Materials (XLB) also representing these types of names.
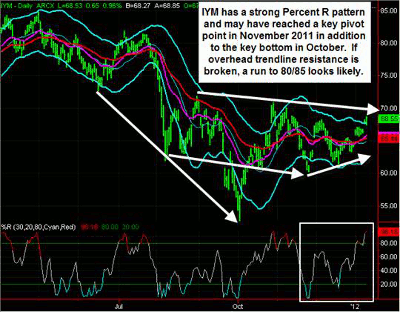
Here is an IYM daily chart:
IYM also had a clear October bottom, which was a third data point in a sharp downtrend line from June 2011. There also was a sideways down-trending range from August to December.
However, we may have seen what I would call a key pivot point in November since that time, %R made a bullish pattern and there have been several gaps higher. Breaking the top of the previous resistance range will allow IYM to run to the $80-$85 level.
So looking at the winning stocks of the very early part of 2012 provides some sector ideas to analyze (in addition to individual stock names) due to the prominence of certain groups on the overall list.
These sectors are all staging rebounds in different formats from 2011 downtrends and bottoms and are forming narrowing wedges and/or pushing up against previous resistance trend lines. It looks like breakouts to the upside are likely (and/or continued strength).
If I had to rate these charts in terms of most attractive over the next few months, I would put the iShares DJ US Basic Materials Index Fund (IYM) first, followed closely by the Market Vectors Semiconductor ETF (SMH), and then the Select Sector SPDR - Financials (XLF).
By Moby Waller of BigTrends.com
At time of writing, there were no open positions in any of these in ETFTRADR, which is BigTrends’ real-time ETF option trading program that targets strong moves over a short-term time frame. New positions could be executed at any time.


