Learn to spot the telltale signs of reversals on the charts and become better prepared to anticipate and capitalize on the impending movements in the market.
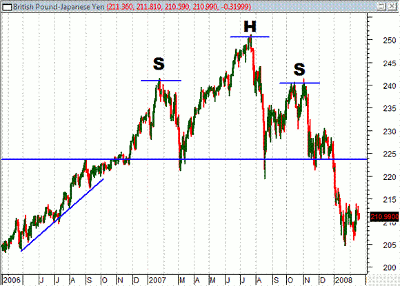
Market trends eventually reverse. Sometimes those changes in trend occur with little or no warning, and other times the market telegraphs a signal that changes may be imminent. One of the most important signals we look for are head-and-shoulders reversal patterns.
One of these appeared recently on the S&P 500, which may mean serious declines in the near term for stocks, and other changes in related markets.
If a security or currency pair is really is at the end of its trend and is ready to turn around and head home, a reversal pattern will form while the security or currency pair consolidates. Reversal patterns tell you that the market is going to turn around and reverse its previous trend after it breaks out of the continuation pattern.
This article will provide some details about the head-and-shoulders pattern and what we look for in other reversal patterns.
Identifying Reversal Patterns
Reversal patterns, like all price patterns, are made of the following four pieces:
- Old Trend: The trend that the equity or currency pair is in as it starts to form the price pattern
- Consolidation Zone: A constrained area defined by set support and resistance levels
- Breakout Point: The point at which the equity or currency pair breaks out of the consolidation zone
- New Trend: A reversal of the old trend that the equity or currency pair enters as it comes out of the consolidation zone
NEXT: Reversal Pattern Attributes
|pagebreak|Reversal Pattern Attributes
Reversal patterns form in a few different shapes, but for the most part, they look quite similar. The only real difference you will see is in the shape of the consolidation zone. The consolidation zones of some reversal patterns have a single level of support and single level of resistance, while others have multiple levels of support and multiple levels of resistance. Every other aspect of the price pattern is identical.
Reversals During an Uptrend
The following are the most common reversal patterns you will see during an uptrend:
Double Tops: Double tops form during an uptrend as the uptrending equity or currency pair hits the same resistance level twice in the consolidation zone.
Triple Tops: Triple tops form during an uptrend as the uptrending equity or currency pair hits the same resistance level three times in the consolidation zone.
Head-and-Shoulders Tops: Head-and-shoulders tops form during an uptrend as the uptrending equity or currency pair hits a lower resistance level, then hits a higher resistance level, and then hits the lower resistance level a second time in the consolidation zone.
See related: The Chart Pattern as Easy as ABC
Reversals During a Downtrend
The following are the most common reversal patterns you will see during a downtrend:
Double Bottoms: Double bottoms form during a downtrend as the equity or currency pair hits the same support level twice in the consolidation zone.
Triple Bottoms: Triple bottoms form during a downtrend as the equity or currency pair hits the same support level three times in the consolidation zone.
Head-and-Shoulders Bottoms: Head-and-shoulders bottoms form during a downtrend as the equity or currency pair hits a higher support level, then hits a lower support level, and then hits the higher support level a second time in the consolidation zone.
Learning to identify price patterns enables you to get a glimpse into the future price movement of the market you're trading. Whereas technical indicators like moving averages and the commodity channel index (CCI) lag the current market price, price patterns project into the future.
Once you have identified a breakout point, you can get a pretty good idea of where the price is going to go in the near future, and you can take advantage of that potential movement.
By John Jagerson of LearningMarkets.com


