Using a real option chain as an example, learn to extract the most vital information, block out the “noise,” and spot more high-probability trading opportunities.
Recently, I taught a class in Houston, Texas, and many of the students had a hard time understanding what they should be actually focusing on when looking at an option chain. In class, we use the TradeStation option analysis window, which displays the option chain. Many of the students expressed that they felt intimidated when looking at this information.
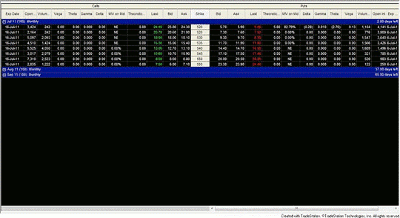
The figure below shows the default setting that loads up to an empty workspace when using the TradeStation option analysis window. This one shows the Google Inc., (GOOG) option chain in the last week prior to expiration day.
There is a lot of information included in an option chain, and looking at Figure 1, you can see why the students had so much confusion. Here is an explanation of some of what is included in the default options pane in TradeStation:
There are two gray horizontal lines; calls are on the left of the top line and puts are on the right. The gray line below has 12 items on the call side to the left of the strike column and 12 items on the put side to the right of the strike column.
And this is only showing the options for the front month. No wonder students say that there are too many pieces of data to look at for every single month.
Fortunately, the fact is that TradeStation is quite customizable, so it very easy to change the settings of the column's display to show us whatever our hearts desire and in whatever colors we choose. After showing the students in class all the amazing capabilities of the platform, they still needed to know the bare minimum amount of information that they should be looking at.
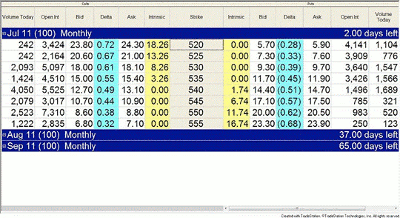
The answer is: bid and ask, Deltas, intrinsic values, and open interest (volume today is a bonus).
NEXT: A Closer Look at the Most Crucial Data
|pagebreak|The figure below shows an enlarged and color-coded version.
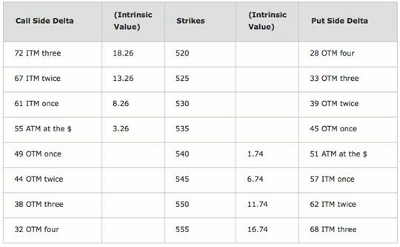
Yet even after getting rid of many items, the students still had a hard time grasping two important concepts: Delta and the intrinsic value. Hence, I have taken these two items out of the option chain and typed them into the table below.
This focus is placed not on the premiums, but on the value that is true, the intrinsic value. Observe that the Delta reading is included together with the facts of the strike price being in the money (ITM), at the money (ATM), or out of the money (OTM).
To figure out where the current price of GOOG is, one can simply add two numbers together: The intrinsic value and the strike. For instance, on the call side, $520 (strike) + $18.26 (intrinsic) = $538.26, or for the put side, $555 (strike) - 16.74 = $538.26.
In addition, the importance of Delta as the probability of options expiring in the money was explained. As an example, we looked at the 525 put both as a buyer and as a seller just before the expiry. This particular put has a Delta of 0.33 and is three steps OTM.
NEXT: See Case Study Using Google (GOOG) Options
|pagebreak|Buyer of a 525 Put
Buy to open (BTO) 1 July (three five-dollar steps OTM) 525 put @ $7.60
If a single contract of the 525 put option was bought to open for $7.60, then its breakeven point (BEP) would be the difference between of the two.
Breakeven point: $525 – $7.60 = $517.40
In order to overcome the time value (fluff) that was purchased, GOOG would have to drop from the current price to below our BEP. GOOG would have to fall $20.86 from its current price (at time of writing) to get us to breakeven ($538.26 – $517.40 = $20.86).
This drop of over 20 points needs to happen in the next few days. And knowing that before earnings anything is possible, it is best to stay out of trading around earnings.
Seller of a 525 Put
Sell to open (STO) 1 July (three five-dollar steps OTM) 525 put @ $7.60
If the single contract of 525 put option was sold to open for $7.60, then its breakeven point would be the sum of the two.
Breakeven point: $525 + $7.60 = $532.60
Notice that at the time, GOOG was at $538.26 and this trade can even go a bit against the seller and still be profitable.
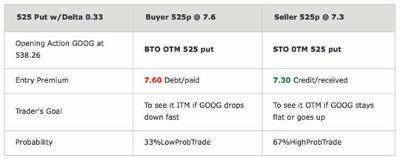
For simplicity's sake, I have compared the differences in the goals of the buyer of puts versus the seller of puts.
In conclusion, the buyers of out-of-the-money (OTM) options have a low probability of achieving their goals. If the Delta was 33%, that number is also the probability of seeing the option expire in the money. The sellers need to flip the Delta around because their goal is to see the sold OTM option expire out of the money.
By Josip Causic, instructor, Online Trading Academy


