There's a big buildup in October S&P 500 Index (SPY) put open interest, which could have a significant impact on the market in October. Now, some of this open interest has been in place for quite some time, so let's not assume these are from gigantic recent put purchases betting on an impending market downturn.
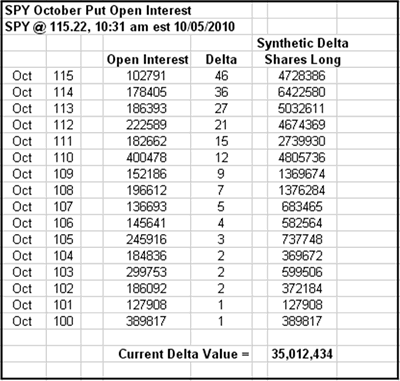
But, there certainly is a large buildup in the October 115 through 100 SPY puts. Let's examine this from the market maker's perspective and see what risks/impact it may have on the markets. Remember that I'm isolating this put open interest alone for education value, while in reality, this is part of a much larger SPY option open interest total package. Additionally, I'm using the assumption that all of this open interest was from option purchases (most of the public is in fact option buyers and many institutions may buy put protection for their long portfolios), so the SPY market makers are "short" (have sold) all of these options.
It's also important to note that market makers look at options they have bought/sold as "Deltas," basically the number of shares that the options represent at that point in time. Most market markers then make themselves "Delta-neutral" by hedging the option deltas with the underlying stock. If they are short (negative) options deltas, they will buy the underlying stock/security to hedge, and vice-versa if they are long option delta.
Let's take a look at this large buildup of (currently out-of-the-money) SPY October puts and what the delta impact is at a moment in time:So on our assumption that the floor traders have sold all of these October puts, they are synthetically long 35 million SPY shares. So the hedge for this is that they are short 35 million SPY underlying stock. Remember that the Delta values listed above are for a moment in time and change dynamically. For example, if SPY instantly drops to 110, then the Delta on that 110 option would jump to close to 50. This would make a market maker instantly synthetically long more SPY underlying stock, and he/she would subsequently need to sell/short some more SPY stock to hedge their position (this hedging is not always instantaneous, but often will need to be done by the end of the day, for example). This can create short-term selling pressure on the stock if many traders are hedging large positions.
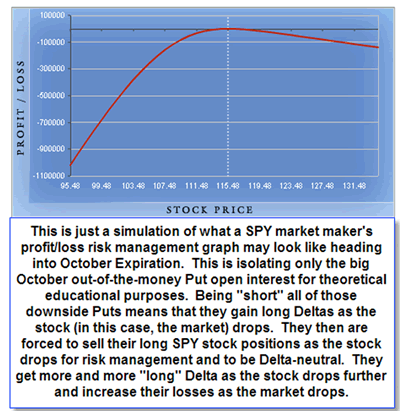
Below is a simple theoretical example of what this isolated put open interest and hedged SPY underlying position may look like as a profit/loss graph. This is similar in basic tone to the risk management graphs that I received as a market maker on the CBOE, but doesn't include many of the other aspects, including different dates, volatilities, Greeks, etc.
Option Position Profit/Loss Risk GraphThe basic gist of this isolated theoretical position is that by being short so many downside SPY puts, the market makers face an accelerating risk if the market corrects sharply heading into October option expiration. If the market remains within a quiet range (as it mostly has recently), the floor traders will likely be buying back their short SPY stock (because the Deltas will be eroding the puts), and this can actually create some moderate buying pressure on the market. If there is a super strong rally, in this theoretical situation, they may be scrambling a bit to buy back their short SPY underlying.
There is more to the hedging story we could explain, but the bottom line is that this big downside put open interest does give some risk to the markets heading into October option expiration. Remaining above the SPY 115 strike gives the market (and market makers) some breathing room.
By Moby Waller of BigTrends.com


