If you are tempted by recent positive economic data to jump into the market with both feet or head to the beach for the summer and forget your portfolio, you might want to rethink your strategy, counsels MoneyShow's Tom Aspray.
The bullish stock market in 2013 has fueled a surge in IPOs over the past six weeks as $5.2 billion has been raised by 26 new companies. The fact that Facebook, Inc. (FB) has finally moved above its initial offering price has also reassured investors.
The major averages are flat to up slightly for the month after last week's decline. As I concluded last week, one should not expect August to match the outstanding gains that we saw in July. The slight weakness early last week made many commentators turn cautious rather quickly.
Stock investors should have been happy with their July account statements and with the further new market highs in early August. Of course, the concern over the global economy has still kept many out of the stock market despite the year's impressive gains.
The outlook for the US economy has continued to improve, and late last week, there was trade data out of China suggesting its economy may be stabilizing. It would be good to see consecutive positive data points out of China as the trend has not been consistent.
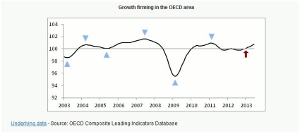
There were more signs of improvement for the global economy as the Organization for Economic Cooperation and Development's (OECD) composite leading indicators pointed to firming economic growth. The chart shows that the indicator dropped below the 100 level in 2011 but then moved back above it in 2013.
Japan, the United Kingdom, and the United States show evidence of firming economic growth. In the euro area, the growth trend looks the best for Germany, with improvement in Italy, but rather flat action in France. Their growth momentum analysis still suggests slowing in China, Russia, and Brazil.
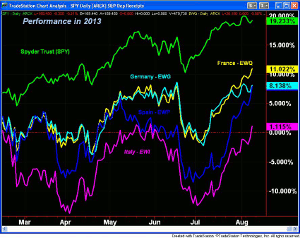
A few weeks ago, I focused on some of the euro countries' debt levels, as well as the improvement in some of their manufacturing data. Their stock markets have continued to rally sharply as the iShares MSCI France (EWQ) is up over 13% since early July and is doing just slightly better than Germany (EWG).
Even more surprising is Spain whose unemployment rate is over 26%. The iShares MSCI Spain (EWP) was down 6% for the year in late June, but is now up over 11%. All three look positive technically but are closing the week above their starc+ bands indicating that we should get a better entry point in the next few weeks.
NEXT PAGE: What to Watch
|pagebreak|In the US, the focus was still on the Fed as speeches by several Fed governors led to speculation about when the Fed would reduce its bond buying. Rates were pretty flat for the week but bond holders are still nervous as most bond portfolios have had a rough year.
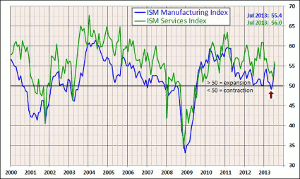
It was only a few months ago that many were concerned that the ISM Manufacturing Index had dropped below the widely watched 50 level (see arrow), which suggested that the economy was contracting. It turned around quickly as it jumped to 55.4 in July and the ISM Services Index jumped to 56. This has turned the chart of both positive, which is consistent with an improving economy.
For the investor, especially those not invested in the stock market, this data might encourage one to jump into the stock market with both feet. Those who are already invested may head to the beach for their summer vacation assuming that their portfolio does not need close watching. Both approaches, I think, are dangerous right now.
The gradual loss of upside momentum for the stock market that I have been noticing recently does suggest a more cautious approach. Though it doesn't rule out new highs for the market averages, it does warrant a defensive position.
The stock market will have much more data to contend with this week as Tuesday we get Retail Sales, Import, and Export Prices, along with Business Inventories. The Producer Price Index is out on Wednesday with the Consumer Price index on Thursday.
Also out on Thursday, along with the jobless claims, is the Industrial Production and the Philadelphia Fed Survey. Last week, the jobless claims reached their lowest level since 2007. The week ends with the Housing Starts on Friday.
What to Watch
The major stock averages tested initial support last week with the heaviest selling on Friday but the averages did close above their worst levels. Still, there is no confirmation of a completed top as while the market internals have formed some divergences they have not yet broken down. Also a sharply lower weekly close below the prior few weeks' lows, as I mentioned earlier in the year, is often a clear sign that a correction is underway.
As I discussed last week, those on the short side this summer have been beaten up pretty badly and may have given up on selling this market. Also those who have been using the VIX options or other strategies to protect their portfolio are tired of losing money. They may think now that protection is no longer necessary.
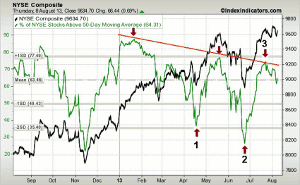
There are a number of signs that the market is now in a high-risk area as it certainly is not oversold. This chart of the number of NYSE stocks above their 50-day MA has changed quite a bit since I last featured it in late June when it had just bottomed (point 2).
It was even more oversold in June than it was in April, point 1, when it just dropped to 35. The chart now shows a series of lower highs from early in 2013 and then at the May highs. It hit over 75 in the latter part of July (point 3) and is now trying to turn up from below the mean of 63. If it should drop back below the recent lows, it will confirm a further loss of upside momentum.
I have been looking at several different industry groups that look vulnerable, including; the euro banks, home improvement stocks, as well as the most overbought Dow stocks.
There has been a clear rotation amongst the sectors and having a good level of cash will allow one to get more fully invested at more favorable levels.
The individual investors became a bit more bullish last week at 39.5% from 35.6% the previous week. It is still down from the highs a few weeks ago. The number of bears also rose to 26.6% as it was below 20% just five weeks ago.
The number of bullish financial newsletter writers has jumped to 51.6% while the number of bears has dropped even lower to 18.5%.
NEXT PAGE: Stocks
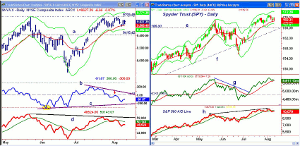
|pagebreak|The NYSE Composite has continued to lag the other major averages as it has failed to close significantly above the May highs. It did make a new daily closing high last week but a strong close above the 9705 level would be more impressive. The daily starc+ band is now at 9772.
Prices bounced from the 20-day EMA, which is now at 9569 and a close below 9500 should trigger heavier selling. There is next good support at 9415, line a. The weekly starc- band is at 9087.
The McClellan oscillator has been diverging from prices since the middle of July, line b. It failed to move back above the zero line (see arrow) as the NYSE was making new highs, which is a sign of weakness. It is now slightly oversold at -87.
The NYSE Advance/Decline has been acting weaker than prices as it failed to reach the May highs. This negative divergence, line d, is a sign of weakness as it has dropped below its WMA and shows a pattern of lower lows.
S&P 500
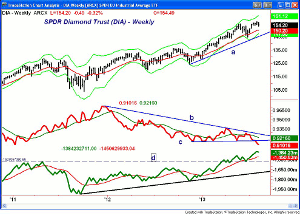
The Spyder Trust (SPY) tested its 20-day EMA twice last week, which is currently at $168.64. The next support is at $167.52, which was the late July low and corresponds to the daily starc- bands.
The more important support is in the $166 area, line e, which corresponds to the mid-June highs. A drop below this level could mean a decline to the $162-$163 area. There is resistance now in the $170-$171 area.
The daily OBV did confirm the recent price highs and is still holding slightly above its WMA. The OBV staged a strong upside breakout above the resistance at line g in early July, which was a bullish signal.
The S&P 500 A/D line made slightly higher highs last week (line h) but then dropped below its WMA. It will look more negative if we get a very weak day of A/D ratios.
Dow Industrials
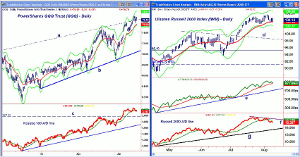
The SPDR Diamond Trust (DIA) held just above the monthly pivot at $153.07 last week as it did make new four-week lows. A close below this level this week would increase the downside momentum. The 20-week EMA is now at $150.27 The weekly uptrend, line a, and the June lows are in the $145-$1146 area.
The weekly relative performance dropped to new correction lows in July (line c) indicating that the Dow is still acting weaker than the S&P 500. There is strong resistance now at the downtrend, line b.
The weekly OBV does look much stronger as it staged an impressive breakout (line d) early in the year and has been acting stronger than prices. It made significant new highs in the past few weeks.
Nasdaq-100
The longer-term daily chart of the PowerShares QQQ Trust (QQQ) shows the July breakout above the trend line resistance at line a. It is still close to the 2013 highs at $77.08 with the daily starc+ band now at $78.03.
There is minor support now at $75.74, which is just above the 20-day EMA at $75.61. There is stronger support now in the $74 area.
The Nasdaq-100 A/D line did make new highs with prices, though it closed the week just barely below its WMA. The WMA appears to be flattening out but has not yet turned lower. A break below the June lows would be more negative. There is stronger support now at line c, and then at the uptrend.
Russell 2000
The iShares Russell 2000 Index (IWM) made another new all-time high last week and dropped back to test its flattening 20-day WMA at the end of the week. The daily starc+ band is now at $106.71 with the quarterly R2 resistance at $106.65.
The daily OBV still shows a very bullish pattern of higher highs as it is holding well above its rising WMA. There is long-term support at the uptrend, line e.
The Russell 2000 A/D line has not confirmed the new highs as it has formed a pronounced two-week divergence, line f. It is well below its WMA, which is now flat. There is more important support for the A/D line at line g.
The daily starc band is at $102.38, which is very close to the monthly pivot at $102.03. There is further support in the $100.38 to $101 area.
NEXT PAGE: Sector Focus, Commodities, and Tom's Outlook
|pagebreak|Sector Focus
The iShares Dow Jones Transportation (IYT) reversed to the downside last week as it gave up most of the prior week's 2.7% gain. There is next support at $114.35, which is the monthly pivot with the June low at $113.42.
The weekly relative performance is still locked in a tight range as the failure to close higher for several consecutive weeks has not allowed it to break out. The OBV is positive and did confirm the recent highs.
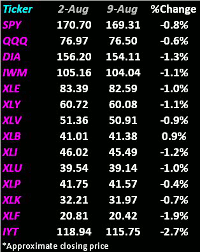
Of the 14 ETFs included in my weekly table, the Select Sector SPDR Materials (XLB) was the only gainer, up 1.1%. The next best was the Select Sector SPDR Consumer Staples (XLP) as it was down just 0.4%.
The Select Sector SPDR Health Care (XLV) and the Select Sector SPDR Consumer Discretionary (XLY) were both down less than 1%. The Select Sector SPDR Technology (XLK) and PowerShares QQQ Trust (QQQ) were also down just slightly after their recent sharp gains.
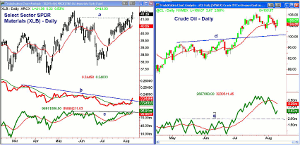
The chart of the Select Sector SPDR Materials (XLB) shows that the resistance going back to May, line a, was overcome late last week. The rising 20-day MA has held on several tests over the past month.
The relative performance has broken its long-term downtrend, line b, which is a positive signs as this lagging sector may have finally bottomed. The OBV was also able to overcome its resistance at line c.
Crude Oil
Crude oil closed the week down just under $1 but put in a strong performance on Friday as it was up over $2. The sideways pattern over the past three weeks looks like a continuation pattern, which is likely to be resolved to the upside.
The next upside targets are in the $112 area, which would be very positive based on the yearly analysis. The daily OBV has dropped well below its WMA but is still above the major support. The weekly OBV (not shown) is positive.
Precious Metals
The Spyder Gold Trust (GLD) declined early in the week but then managed to close the week a bit higher. The rally from the June lows still looks like a bear market rally, which is setting up a bull trap as I mentioned last week. Watch for a close below $164 to support this view.
The Week Ahead
Though it was not a bad week in the stock market in terms of price action, there were more signs that the market has lost its upside momentum. Another push to new highs is possible early in the week, but I still think we are likely to see a 5% drop, if not more, by the middle of September. Therefore be sure to have a plan, as well as your stops, in place now.
Of course, not all stocks will decline with the market, but I continue to think that we will have some very good buying opportunities in the next month or so. Once the market does correct, we should get a better idea who are the new market leaders. With global economies improving, it may finally be time for the materials sector to catch up.
If stocks do decline, we should see a rebound in bond prices, which will be an opportunity to adjust your bond portfolio if you are over invested on the long end of the curve.
In last week's article, It's Never Too Late to Build a Portfolio, I detailed the dollar cost averaging strategy I have been recommending for those who are not in the stock market. I also reviewed a couple of my favorite mutual funds, but commission-free ETFs would also work.
Don't forget to keep an eye on my Twitter feed as I will often Tweet my new recommendations before the opening.
- Don't forget to read Tom's latest Trading Lesson, When Will the Homebuilders Turn Around?

