Watching the technical data will give you a clearer picture of the market than any talking head. And this week's holiday gives investors an opportunity to evaluate each one of their holdings, and that shouldn't be passed up, writes MoneyShow's Tom Aspray.
The world markets had the widest ranges last week that we have seen in quite a while. An increase in volatility is often seen prior to a more extended correction. It was a plus that the major averages, especially the stock index futures, closed last week above the prior week's lows.
Many of the averages did form daily key reversals on Wednesday, but they have short-term significance when not accompanied by other technical negatives. As I discussed a few weeks ago, a sharply lower weekly close is often the first sign that a top is being formed.
The German Dax closed the week down just over 1%, even though the country's latest reading on business confidence was the best in several months. And though many of the US averages closed the week over 1% lower, the recent highs were confirmed by both the weekly and daily technical studies. This suggests that at worst, we are in the early phases of the top-building process.
The market's problems started Wednesday, as the comparison of Ben Bernanke's comments with the FOMC minutes that had just been released spooked investors. The concern that Fed's bond-buying program might end earlier was the reason to sell.
The competition to outdo one another on the various financial networks is fierce, but I would recommend that investors not pay attention to these Fed whisperers. Keeping an eye on what the weekly and monthly market data will be much more illuminating, as major trend changes show up on the technical side well ahead of the fundamentals. For instance, the homebuilders completed their major head-and-shoulders top formation in 2006, well before the housing market collapsed.
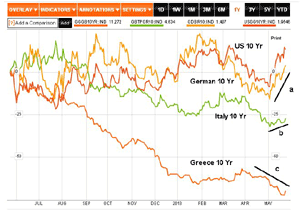
Global rates moved higher last week, but interestingly, the increases were the most pronounced in the bonds of the strongest countries, the US and Germany. The uptrends in the yields of the German ten-year Bunds and the US ten-year T-Notes (line a) shows a sharp increase since the start of May.
In contrast, the yields on the Italian ten-year bond have just risen slightly (line b). Rates on Greece's ten-year are still basically in a downtrend (line c), but have fallen from the extremely high yields of a year ago.
Also, a gradual increase in rates is not always a negative for the stock market. It could encourage some bondholders to shift from bonds to stocks.
On Monday, I will be releasing a special report discussing my outlook for US rates. The recent increase in both long- and short-term yields has brought them to levels where they are close to completing weekly bottom formations. One should keep in mind that it would take much higher yields to reverse the major downtrend.
NEXT: More Strategies and Economy
|pagebreak|Over the past few weeks, in columns like Put the Odds in Your Favor Now, I have been advocating raising cash and taking profits. The percentage of cash in the Charts in Play Portfolio has increased significantly in the past two months.
The next few weeks are likely to be equally difficult as a fewer number of stocks will be able to go up significantly if the overall market does correct more sharply.
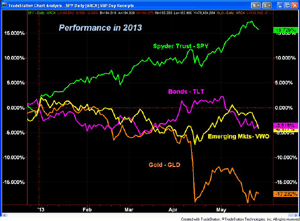
The Performance chart below shows that stocks have been the only game in town in 2013, as the SPY is up 15.6%, while bonds as represented by the iShares Barclays 20+ Year Treasury Bond (TLT) are down about 3.4%. Emerging markets, represented by Vanguard FTSE Emerging Markets ETF (VWO), have lost just over 4% so far this year.
Of course, the Spyder Gold Trust (GLD) has been the real casualty, having lost over 17% so far this year. It is now retesting the lows from the middle of April. And silver has been getting even more press as prices have realty crashed.
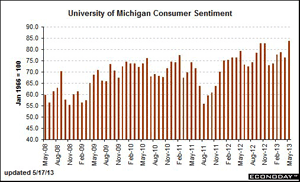
Over the past two weeks, economic data has generally been quite good. The consumer sentiment data released on March 17 was much stronger than expected, as it jumped to 83.7, up from 76.4 the prior month.
Last week, existing home sales and new home sales were both better than expected. Durable goods were also well above expectations. The data on manufacturing was also encouraging, as the flash PMI Manufacturing Index and the Kansas City Fed Manufacturing Index both reflected steady growth.
This week, we get a host of new data, which should help investors get a better reading on the economy. After the long weekend, we get the S&P Case-Shiller Housing Price Index and consumer confidence numbers on Tuesday. Also, we get more data on manufacturing from both the Richmond and Dallas Fed surveys.
The declining jobless claims have been a strong positive factor for the market, and we get the next reading on Thursday, along with the first revision of first-quarter GDP. Friday brings the personal income and outlays data, Chicago PMI, and the final monthly reading for May on consumer sentiment from the University of Michigan.
NEXT: What to Watch
|pagebreak|What to Watch
From May 14, prices accelerated to the upside until Wednesday's reversal, which must have really punished some of the perennial bears who never thought the S&P 500 would get to even 1,600 or 1,625.
Friday's close was mixed. The Dow finished up, while the S&P 500 and Nasdaq were down slightly. All were sharply lower in early trading, just like Thursday. The market's resilience is impressive, and is a positive sign for next week's trading.
They market's outlook is still bullish, despite last week's losses, and we still do not have firm sell signals from either the daily or weekly technical studies. On May 15, a total of 517 stocks made new highs on the NYSE, which is consistent with a positive major trend.
Though this was not mentioned in Thursday's column, 3 Reasons to Avoid Panic Selling, it was another good reason to stick with your plan and the stops that you worked out before the reversal.
At Thursday's low of 1,636, the S&P 500 was already 3% below Wednesday's highs. I would not be surprised to see prices get back toward these highs in the next week or two, but given the nature of Wednesday's reversal, they may not be exceeded.
Bullish sentiment of individual investors jumped again last week, according to AAII, as 49% are now bullish, up from 38.5% the previous week. Only 21% are bearish now, which is the lowest reading so far in 2013. This number will likely jump this week.
Financial newsletter writers have continued to become more bullish, from a low of 44.3% on April 24, to 55.2% currently. Only 18.8% are bearish, which was a level last seen a few weeks ago.
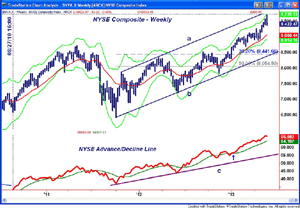
The weekly chart of the NYSE Composite shows that the weekly Starc+ band and upper channel (line a) were both tested last week. The NYSE came close to closing below the prior week's low at 9,397 but it did not.
There is next good support at 9,256, and then the rising 20-week EMA at 9,060. This is approximately 3.8% below Friday's close.
The 38.2% Fibonacci retracement support from the 2011 lows is at 8,441, which is more than 10% below current levels, and also corresponds to the uptrend (line b).
The weekly NYSE Advance/Decline line did make new highs two weeks ago, but turned lower this week. The WMA is still rising strongly, but could be tested on a further correction.
NEXT: Stocks and Tom's Outlook
|pagebreak|S&P 500
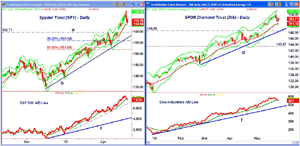
The Spyder Trust (SPY) almost reached the daily Starc+ band with its high at $169.07 last week. By the next day, it was already back to the Starc- band. The next support is at $163.65 and the flattening 20-day EMA.
There is more important support at $159.71 (line a), which was the April high. The daily uptrend (line b) is at $157.50, with the 38.2% retracement support at $155.94. This is about 5.4% below Friday's close . This is a potential downside target if a top is confirmed.
The daily S&P 500 A/D line did make a new high last week, and closed Friday just barely below its rising WMA. The A/D line is still above its short-term uptrend (dashed line) and well above long-term support (line c).
Dow Industrials
The SPDR Diamond Trust (DIA) had a high last week of $155.14, which was very close to its Starc+ band. The low Thursday was $151.55, which now provides first support. There is also converging support at $148.69 and the uptrend (line d).
The daily Dow Industrials A/D line did close well below its WMA on Friday. But typically before a top is completed and the selling becomes more serious, the WMA will flatten out, which takes a week or more. The A/D has next good support at line f.
Nasdaq-100
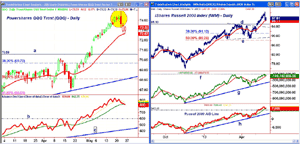
The PowerShares QQQ Trust (QQQ), after closing the prior week above its weekly Starc+ band, formed a doji on Monday. So with Wednesday's reversal, an LCD was triggered (highlighted in yellow). It closed down approximately 1.4% for the week, and was the weakest of the four.
QQQ made lower lows on Friday, but still closed above the 20-day EMA at $72.67. The September high at $70.58 area now becomes an important level of support. There is further support at the April high of $70.15, followed by the 38.2% Fibonacci retracement support at $69.72.
The Nasdaq-100 A/D line did form a slight divergence last week, and is acting the weakest of the five A/D lines that I follow. It closed the week below its WMA, which has started to flatten out. The next support for the A/D line sits at the April highs (line b).
There is now a band of resistance in the $73.70 to $74.40 area.
Russell 2000
The iShares Russell 2000 Index (IWM) reached the 161.8% Fibonacci retracement target from the March-April correction early Wednesday, before reversing to the downside. The 20-day EMA was tested late last week. The next support is at $95.10, which corresponds to the March highs.
There is additional support at the breakout level (line d) of the flag formation. In early May, you will recall that the "measured target from the flag formation was in the $99 to $101 area." The high last week was $100.38.
The daily OBV did not confirm the recent highs, but is still holding above its WMA. A strong close early next week could still cause the OBV to break out to the upside. There is important support for the OBV at line g.
The Russell 2000 A/D line did confirm the price highs and is trying to hold above its rising WMA. There is further support for the A/D line at the March highs and then the uptrend (line h).
NEXT: Sector Focus, Commodities, and Tom's Outlook
|pagebreak|Sector Focus
The iShares Dow Jones Transportation (IYT) stayed above the monthly pivot resistance at $115.90 for several days before it reversed. Despite the drop, the weekly and daily OBV (not shown) are still positive.
Transportation was one of the weaker sectors, as it lost 2.6%. Only the Select Sector SPDR Utilities (XLU) was weaker, closing down close to 4%.
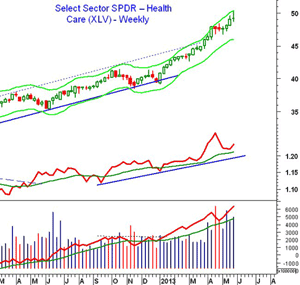
The Select Sector SPDR Health Care (XLV) was the best performer, down "just" 0.1%. The weekly Starc+ band was exceeded last week. The weekly relative performance also did not confirm the most recent highs, as it peaked in April. The RS line is still above its WMA.
The daily and weekly OBV both confirmed the new highs last week.
As the table below indicates, quite a few of the sector ETFs, like the Select Sector SPDR Staples (XLP), Select Sector SPDR Consumer Discretionary (XLY), and Select Sector SPDR Energy (XLE), were down about 0.7% for the week. The Select Sector SPDR Materials (XLB) were considerably weaker as it dropped 1.8% for the week
Crude Oil
Crude oil had a wild week, closing down $2.42 per barrel. It tested the monthly pivot at $92.57 again last week before closing at $93.82. A decisive break of this support would suggest a drop to the $88 to $90 zone, which will add some pressure to the oil stocks.
Precious Metals
The technical action in the Spyder Gold Trust (GLD) was a bit more encouraging last week, as it held above the lows from five weeks ago at $130.51, and actually closed the week higher.
The weekly OBV has formed a slight positive divergence, and with the extreme negative sentiment, there may be an opportunity on the long side this coming week.
The Week Ahead
I will be spending quite a few hours over the weekend running scans, but my suspicion is that it will be harder to find new buy candidates this week. There are a couple of stocks that appear to be forming long term bases, but fewer and fewer are popping up on the radar.
I will have a new recommendation for income investors in Monday's column, as I am starting an income-only portfolio. It should be available on MoneyShow.com early Monday.
I will be watching the corrections in the ETFs that follow both Japan and China, as they may again test the April lows before their corrections are over.
I will also be reviewing the Charts in Play Portfolio. I would recommend that you take some time this weekend to examine each position in your portfolio. It is much easier to make an objective decision when the markets are closed.
I hope you all have a great Memorial Day weekend, and my thanks to all who serve.
- Don't forget to read Tom's latest Trading Lesson, A Candle Trigger for Market Tops

