Gold is either at the center of the investing universe or it's out beyond Jupiter in the financial news solar system but even if you're not hearing about it everyday, it's no reason to fret; there's still plenty of opportunity in the Midas metal, observes Frank Holmes in Money Morning.
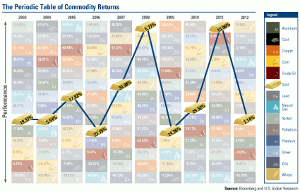
Our ever-popular Periodic Table of Commodity Returns bas been updated through 2012.
My readers love this chart as it shows a decade of results across 14 different commodities, providing strikingly rich information in a very familiar format.
Last year, 11 commodities rose in value, with wheat rising as the top crop after seeing a significant decline in 2011. It was a similar rags-to-riches story for the next few leaders, including lead, zinc, natural gas and platinum, which all climbed double digits in 2012 after falling in 2011.
Only three commodities declined over the year: Crude oil fell by 7% after rising 8% the previous year. Nickel declined for the second year in a row. In 2012, the metal lost 9% and in 2011, nickel fell another 24%.
Coal was the worst-performing commodity in 2012, falling nearly 17%. Coal's been going through a rough spell lately; in fact, the commodity has not been king for five years (although it did record a 31 % increase in 2010).
As you can see from the table, commodities often have wide price fluctuations from year to year given the many factors affecting supply and demand, such as government policies, union strikes, and currency volatility.
That's why when it comes to commodities and commodity producers, many investors "leave the driving" to active money managers who understand these specialized assets and the global trends affecting them.
Take gold and gold companies, for example. After investing in the mining industry for decades, we've taken note of several facts about gold that continue to surprise our investors.
Here are four of the latest:
1. Gold Has Been a Consistent Performer Over the Decade
While the precious metal did not shoot the lights out in 2012, gold's bull rally goes on. It ended the year up 7%, making it a phenomenal 12th year in a row that gold rose in value. In a special gold bar version of the periodic table below, you can easily see gold's rotation among the commodities from year to year.
What's fascinating is the three-year rising pattern relative to other commodities that emerges when you focus on the bars. Over the past 10 years, gold has risen in position compared with the others for three years in a row, then fallen in relative position in the fourth year before repeating the cycle. Will it follow the same pattern and be in the top half of the periodic table in 2013?
2. Gold Should Remain A Hot Commodity In 2013
Considering the global easing cycle and the continuous running of monetary printing presses, I believe the Fear Trade will continue to be a driver of gold over the next several months. Take a look at the projected rise in the balance sheets as a percent of GDP from the European Central Bank, the Bank of Japan, the Federal Reserve and the Bank of England over 2013. The ECB is estimated to have a balance sheet that is nearly 50% of its GDP by the end of the year. The Bank of Japan is right behind the ECB, with its balance sheet projected to be nearly 35% of GDP. As Mike Shedlock of Mish's Global Economic Trend Analysis said, "The race is on to see which central bank can load up its balance sheet with the most garbage the fastest."
My friend Ian McAvity also summed it up well in his Deliberations on World Markets: "Gauging from the panicky actions of the major central banks, I would still prefer to own gold than their paper." With the monetary printing presses warm and real interest rates in the red, gold will likely glimmer for another year.
|pagebreak|3. Gold Is The Least Volatile Commodity On The Table
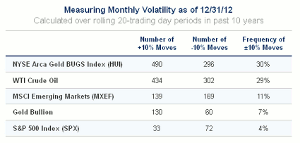
Given the fact that every gold move is analyzed and dissected by the media, it may surprise you that this precious metal was actually the least volatile of the 14 commodities. Its rolling 12-month standard deviation (sigma) over the past 10 years has been 14%, compared to the most volatile commodity, (nickel), which has a rolling 12-month sigma of nearly 60%.
Here's another way to look at the surprisingly low volatility of gold. Take a look at the frequency of 10% moves up or down over any 20 trading days. The metal is only slightly more volatile than the S&P 500. Gold companies, crude oil and the MSCI Emerging Markets Index have all experienced more up-and-down moves than gold.
Whereas card counting at a blackjack table can get you booted from casinos and barred for life, as an investor you are allowed to take full advantage of counting the 10% moves.
4. The Last 4 Years Were Better Than You Thought
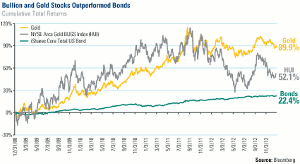
Recently, I showed how the S&P 500 Index and gold bullion significantly outperformed the iShares Core Total US Bond ETF. Many investors asked about gold stock performance. As you can see below, the NYSE Arca Gold BUGS Index (HUI) experienced quite a gain, increasing more than 50% on a cumulative basis since the beginning of 2009. Both considerably outperformed the bond investment.
What's sensational news to precious metals investors sometimes doesn't make the cut as breaking news. Shortly before I was scheduled to talk to CNBC about silver on Friday, my appearance was canceled as reporters preempted my investing insights for what was viewed as a more sensational story about millionaire and fugitive John McAfee.
Related Readings:


