Macro bears have their pick of worries, but the longer-term technical picture still appears favorable. MoneyShow's Tom Aspray shares which sectors and plays look the strongest as we enter a busy holiday week.
It has been another rough week for the stock market. The Spyder Trust (SPY) lost 1.3% for the week, after it managed to close Friday well off the lows.
The worst-hit sector has been technology, as the Apple-heavy Select Sector SPDR Technology (XLK) is down well over 13%. Though the majority of world markets are also lower, the German Dax is down just 6.4% from its September high.
This week does not appear to be any less volatile. Tensions in Gaza are high, Greece’s euro debt problems have not yet been resolved, and we have the ongoing discussions in the US over the fiscal cliff. So which of these three clouds on the horizon worries me the most?
The potential for another war in Gaza and the chance that it could spread is my biggest worry. It could cause a deep shock to the financial markets, if not the global economy. Unfortunately, neither side is big on compromise, which is the same problem facing the US and the Eurozone.
Despite the rally Friday, the market could still see another sharp break to the downside before we get a strong oversold rally. From a technical perspective, we need to see more than a one- or two-day rally to bring us closer to the formation of a market bottom.
As for the fiscal cliff, I still think that those who sold in fear over its consequences will regret it. I expect many stocks to surpass their pre-election levels in the coming months.
On the global economic front, only China seems to be turning the corner. With the announcement of their new leader, I think the government will do whatever it takes to be sure the recovery lasts.
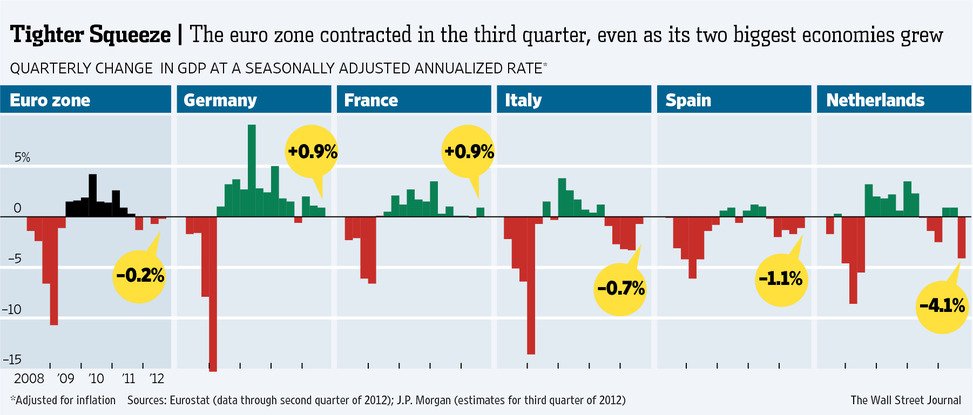
The Eurozone economy contracted in the third quarter, but as the chart shows, the economies of Germany and France did grow. The level of civil unrest is still high in many of the Eurozone countries, as the level of unemployment continues to get worse. It may take a less austere approach to calm the population. However, I think the squabbling amongst the ECB and the various finance ministers will eventually be resolved
The economic data last week generally did not meet most economists' expectations. Retail sales were down, for instance, which indicated less consumer spending...but this was likely impacted by Hurricane Sandy. The Dow Jones Retail Index has dropped just over 6% from its highs, although starting with Black Friday this week, this is a sector that typically does well into the end of the year.
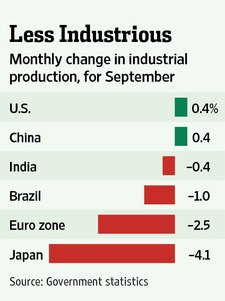
Hurricane Sandy did seem to have a major impact on manufacturing in the Philadelphia region, as the Philly Fed Survey dropped sharply to -10.7â€"well below the consensus forecast of +4.5. There was less impact on the Empire Manufacturing Survey, but the industrial production report on Friday showed a decline of 0.4%.
The table above reflects the 0.4% gain from September. More of a concern is the trend in the majority of the other large global economies: only China has reported a rise in October. The failure of these numbers to stabilize or improve going into early 2013 could signal a significant area of weakness for the economy.
This week, the economic focus is housing, with existing home sales and the Housing Market Index on Monday, followed by housing starts on Tuesday. Jobless claims will be released Wednesday because of the Thanksgiving holiday, along with the PMI Manufacturing Index Flash.
NEXT: What to Watch
|pagebreak|What to Watch
The stock market looked weak heading into last week, and any hopes of a midweek bounce were dashed by last Wednesday’s sharp decline. The market was able to stabilize on Friday, but overall the trend for now remains negative.
As I discussed last week, the evidence does still not suggest that we have formed a major stock-market top, and the charts continue to indicate this is a correction within the overall downtrend. For the overall market, it has not been any worse than the decline that we saw earlier in the year.
Since V-shaped bottoms are rare in the stock market, it is likely to be a few more weeks before a bottom could be formed. The key challenge will be to identify the new market leaders once the market does bottom out. Valero Energy (VLO) and Marathon Oil (MRO) are two companies that are outperforming the market recently, and may become those market leaders.
The individual investor has become significantly more negative on the market: only 28.2% are bullish, a drop of 10% from last week. Financial newsletter writers remain pretty optimistic, as 38.3% are now bullish. This is heading in the right direction; on September 19, some 54.2% were bullish. It would be good to see this number drop below 30% in the coming weeks.
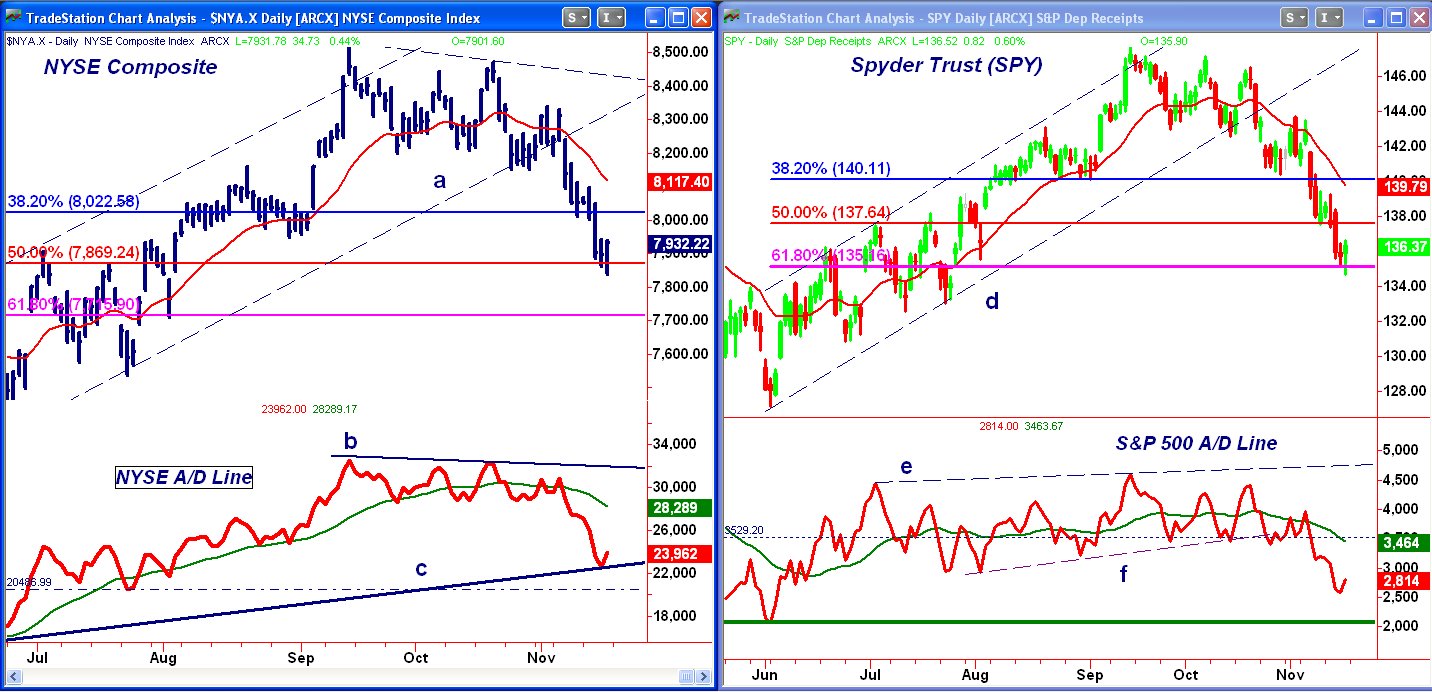
The daily chart of the NYSE Composite shows that the 50% Fibonacci retracement support from the June lows was tested late last week. The average has lost just over 4% since it opened below its uptrend (line a) over a week ago. The 61.8% support is at 7,71, which is about 2.5% below the close last Friday.
The NYSE Advance/Decline line is trying to turn up from its uptrend (line c). A rally back to its declining WMA would not be surprising, but it would take some time for it to complete a convincing bottom.
The fact that the A/D line did confirm the September highs is a positive, as were the new highs last spring. There is initial resistance for the NYSE at 8,000, followed by 8,115 and the declining 20-day EMA.
S&P 500
The daily chart of the Spyder Trust (SPY)dropped below the 61.8% retracement support at $135.16 last Friday, but has not yet closed below it. The SPY was close to the daily Starc- band for most of last week, and the weekly band is now at $133.10.
There is additional chart support in the $132 area, which could be tested before we get an stronger oversold bounce.
The S&P 500 A/D line has dropped well below the support from last summer, and just bounced above its declining WMA before prices plunged. This should now provide significant resistance.
The daily chart has strong resistance now in the $137.50 to $138 area, with the declining 20-day EMA just below $140.
NEXT: More Stocks and Tom's Outlook
|pagebreak|Dow Industrials
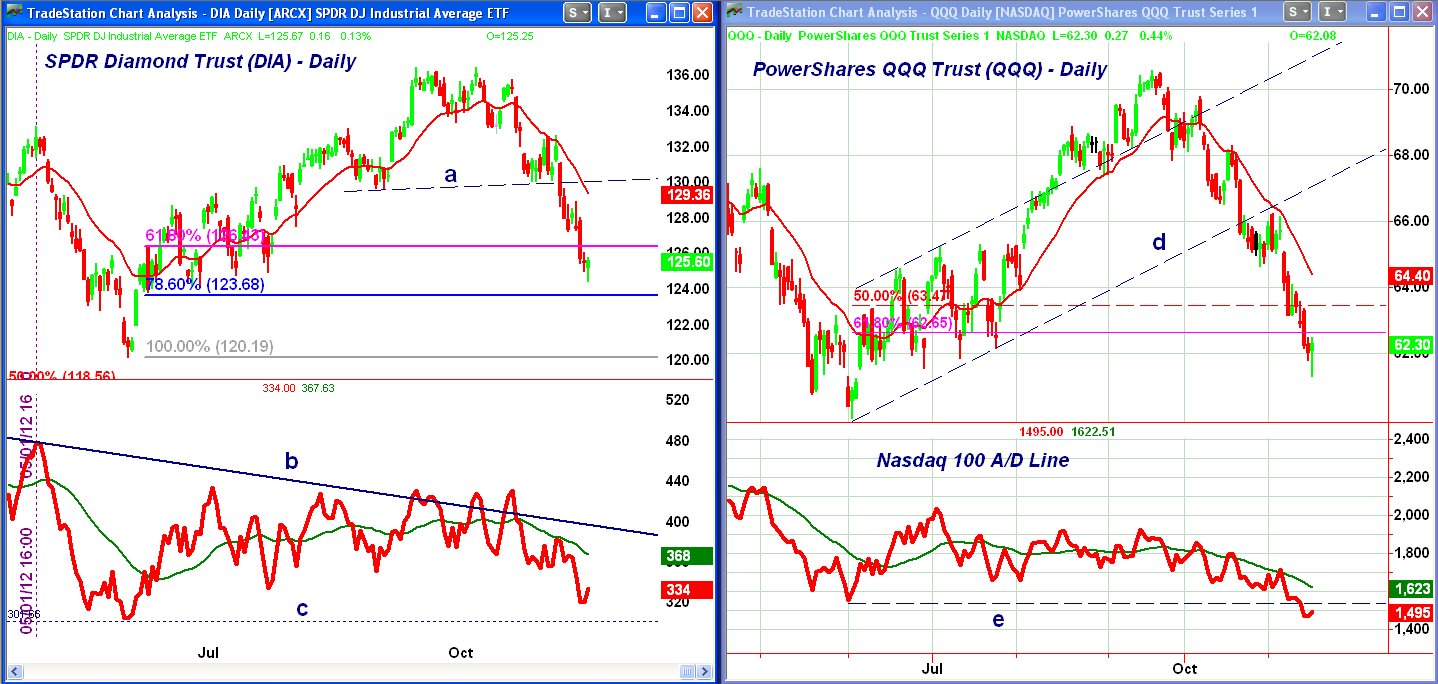
The SPDR Diamond Trust (DIA) has continued to be much weaker than the S&P 500 after breaking the support (line a) in the $130 area. The 61.8% support at $126.37 was violated last Wednesday. The 78.6% support is at $123.99, with the June lows at $120.13.
The Dow Industrials A/D line tried to move above its longer-term resistance (line b) in September and October before it reversed to the downside. The A/D line dropped sharply this week and is getting closer to the support from the June lows (line c).
DIA now has first strong resistance in the $126.50 to $128 area, with major levels at $130 (line a).
Nasdaq-100
The PowerShares QQQ Trust (QQQ) fell to a low of $61.31 last Friday, a drop of 6.7% from the Election Day close. Tech giant Apple (AAPL) sank as low as $505.75 on Friday, which is a 13.2% decline from the close on Election Day.
Apple has now violated the May lows, and if it fails to make new highs on the next major move up, it will suggest that a more important top is in place. I continue to expect that they will do well in the holiday season.
QQQ is still well above the June low of $60.04, and did close Friday above its lows, as did AAPL.
The Nasdaq-100 A/D line dropped below its June lows, which is a negative sign, as the A/D line continues to act weaker than prices. Though the Nasdaq-100 is oversold, it is not yet as oversold as it was last June; only 19% of the stocks are above their 20-day moving averages, as opposed to just 4% last June.
There is initial resistance now around $63.50 to $64, with the declining 20-day EMA at $64.38. There is much more formidable resistance now in the $66 area, which were the highs from early November.
Russell 2000
The iShares Russell 2000 Index (IWM) also violated the 61.8% support at $78.17, as it tested the important chart support in the $76 area on Friday. There is further support now at $75, with the June low next at $72.94.
There is strong resistance for IWM now in the $80 area, with the former uptrend now in the $82 area.
NEXT: Sector Focus, Commodities, and Tom's Outlook
|pagebreak|Sector Focus
The iShares Dow Jones Transportation (IYT) lost another 2% last week, and has dropped back to the October lows. The low from June was $86.09. The failure of the transports to confirm the action in the industrials was really the canary in the coal mine.
I addressed this in a September 7 column, “One Sector Sends a Strong Warning," but clearly did not give it enough weight.
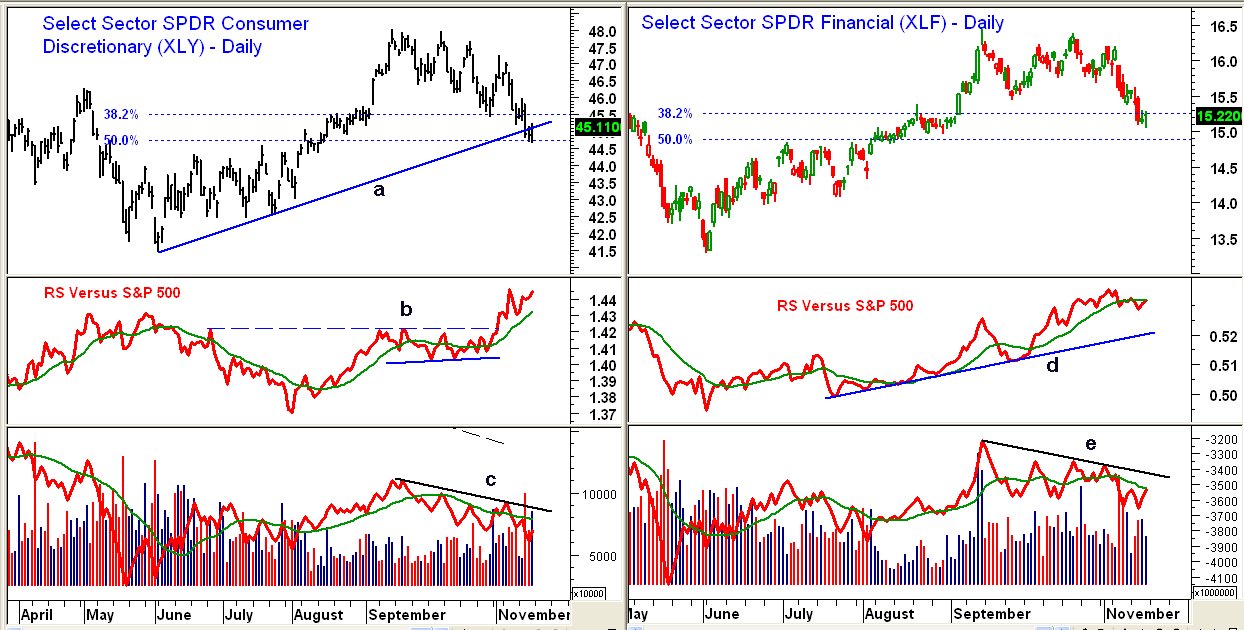
The selling in the various sectors was not as universal as it was the prior week. The Select Sector SPDR Materials (XLB), Select Sector SPDR Industrials (XLI), and Select Sector SPDR Technology (XLK) were all down over 2%, but there were a few better areas. The Select Sector SPDR Health Care (XLV) and Select Sector SPDR Consumer Discretionary (XLY) were both down less than 1% for the week.
The Select Sector SPDR Consumer Discretionary (XLY) bounced from the 50% Fibonacci retracement support on Friday and closed back above the uptrend (line a) from the June lows. A close back above the $46 level would be a short-term positive. This is the sector that contains the retail sector, and Home Depot (HD) is one of its largest holdings
The relative performance broke through resistance (line b) at the start of November, indicating that it was starting to outperform the S&P 500. It has continued to move higher, and is well above its WMA.
The daily on-balance volume (OBV) is still below its WMA and the downtrend (line c). The weekly OBV (not shown) has just dropped below its rising WMA.
The Select Sector SPDR Financials(XLF)was down 2% last week, but as the chart shows, it is holding well above the 50% Fibonacci retracement support at $14.90. There is first resistance for XLF in the $15.50 to $15.70 area.
The RS line is still in a clear uptrend (line d), and has just moved back above its WMA. The OBV also turned higher last Friday, and while it is still below its downtrend (line e), it shows no signs of heavy selling.
Crude Oil
The January crude-oil contract is trying to hold support in the $84 to $85 area, but has shown little reaction to the tension in the Middle East. It was up slightly for the week. The Brent Crude contract is acting stronger.
A daily close back above the $89 level would be the first indication that crude oil had bottomed.
Precious Metals
Both the Spyder Gold Trust (GLD) and the iShares Silver Trust (SLV) closed lower last week, though silver held up a bit better.
This still looks like a pullback after the rally from the summer lows, but if so, prices should start to move higher in the next week or so. If I am correct, the current decline should be a buying opportunity.
The Week Ahead
Clearly the market, though oversold, is still vulnerable, so a cautious approach is still warranted. If we get another wave of selling this week like we did last year, it should set the stage for a rally that will make the bears nervous.
Only if we get clear signs of a failing rally that is close to resistance would I look to put on light hedges through an inverse ETF. I still think that the next good opportunity will be in a few weeks, when we should see evidence of a bottom. That should provide a good opportunity to buy those stocks with the best relative performance.
The financial and consumer discretionary sectors are currently looking the best. I have not yet given up on some of the energy companies.
I hope you all have a great Thanksgiving and are able to enjoy it with family and friends. The next Week Ahead column will be released on November 30.
- Don't forget to read Tom's latest Trading Lesson, Mastering the Basics of Stop Placement

