Friday’s strong showing is a good sign that we may be entering a new uptrend. This makes it the perfect time for risk-mindful investors to catch the bears napping and ease into some of the plays recommended by MoneyShow’s Tom Aspray.
The global stock markets, gold, and crude oil all soared Friday to finish out a rather dismal quarter on a positive note. The Euro Summit’s overnight decision to aggressively fund the teetering European banks certainly got the market’s attention.
Given these summits’ past solutions, many market professionals are justifiably skeptical that this will work, and I doubt anyone really knows the answer. The markets are sending a strong message that this time might indeed be different, as they indicate an important low was reached in early June.
Most of the experts interviewed on the leading financial networks on Friday were still bearish on stocks, as most advised the public to stay out. This to me is a bullish sign, just as it was last September when I wondered if doom and gloom could save the market.
The regular measures of individual investor and financial newsletter sentiment are not as negative as they were last fall, but the professionals are quite negative. This may be enough to provide the market with the proverbial “wall of worry.”
The financial markets responded quite well to the surprising decision by the Supreme Court to uphold the Affordable Care Act. Those who bought puts on some of the health-care stocks in anticipation that the law would be struck down were sorely disappointed. (I still like the action of the health-care stocks, and have quite a few in the “Charts in Play” portfolio.)
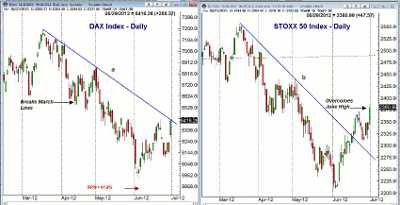
More details will emerge in coming weeks, but the European stock markets appear to have bottomed. The German Dax closed just below the downtrend from the March highs. In April, it was the break in the Dax below the March lows (see arrow) that had me concerned about the health of our market.
The Dax did hold above the key 61.8% Fibonacci support level at 5,819, which I was closely watching. A decisive close above 6,450 will create a new uptrend. The Eurozone blue chip Stoxx 50 index has already surpassed its mid-June highs after breaking its downtrend (line b) on June 18.
As I discussed in Friday morning’s column “Get Ready for the Next Bull Market," the technical action in the US market had already confirmed a short-term low in early June, and was very close to confirming a new intermediate-term uptrend. This could occur in the next week, as I discuss below.
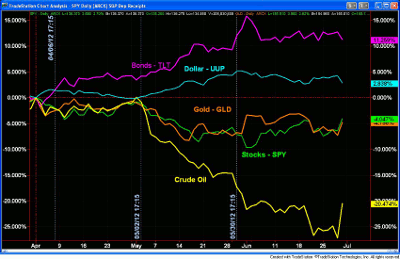
The performance of the five asset classes that I have been monitoring since the start of April—bonds (TLT), the US dollar (UUP), gold (GLD), US stocks (SPY) and crude oil (USO)—also suggests a change may be underway. Only TLT and UUP are up since the start of April, but both have turned lower.
In late May, GLD started to perform better than SPY. The buy levels in the SPDR Gold Trust (GLD) that I recommended in early June have been hit, and GLD may have formed an important low with Friday’s 2.7% gain.
Holiday-shortened weeks are always a problem, especially as the Fourth of July falls in the middle of the week. Many traders are already out, and therefore the volume is likely to be low early this week. If the market continues to rally, the bears will point to the low volume as a reason they do not trust the stock market’s gains.
Even though it is a short week, there is plenty of important economic data, culminating with the monthly jobs report on Friday. The ADP employment report is out on Thursday, which may give us some clues, but the most bullish action would come if the stock market can hold up after we get another weak jobs report.
On Monday, we get the ISM Manufacturing Index and construction spending figures, followed by factory orders on Tuesday. On Thursday, in addition to the ADP Employment Report, the ISM Non-Manufacturing Index will be released.
|pagebreak|WHAT TO WATCH
The stock market was under pressure early last week, as several of the major averages violated short-term support before prices stabilized and closed strong on Wednesday.
Euro debt fears and the mounting losses from JPMorgan Chase (JPM) rocked the market hard early Thursday, and traders were worried the week’s lows could be broken.
The market’s tone certainly changed in the last two hours of trading Thursday, as the S&P 500 closed almost 16 points above the lows. This set the stage for Friday’s upward explosion.
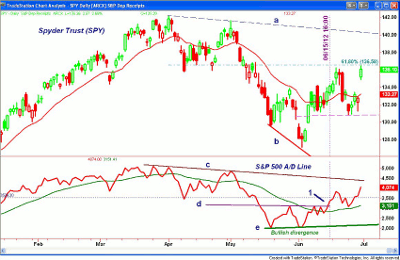
Though the price action was a bit concerning early last week, the chart above shows that the S&P 500 Advance/Decline (A/D) line just pulled back to its gradually rising WMA and retested the breakout level (line d). Though many analysts do not believe in divergence analysis, this is a great example of how it can give you a good reading on where the market is heading.
As the Spyder Trust (SPY) was collapsing in early June, and making sharply lower lows (line b), the S&P 500 A/D line did not make new lows, thereby forming a bullish divergence (line e). In my analysis, the divergence was confirmed when the A/D line moved above the intervening peak (line d), which occurred on June 15 (point 1).
On Friday, I went into an in-depth analysis of the four major market-tracking ETFs that I follow, and will just highlight the changes with Friday’s close. For the S&P 500 A/D line, I pointed out that the next level to watch was the recent peak, and it was overcome on Friday.
A move through the longer-term downtrend (line c) will give a more important intermediate-term buy signal. This would be similar to the signal that was generated last October 13. It would take a convincing break below last week’s lows to weaken the outlook.
S&P 500
The Spyder Trust (SPY) closed just below the mid-June highs at $136.25, with the major 61.8% Fibonacci retracement resistance level at $136.58. A daily close above this level during the week would be a positive sign. As I noted earlier, the Stoxx 50 index has already moved above its mid-June high.
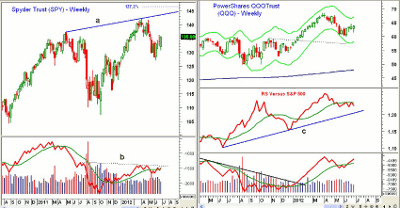
The weekly chart shows that the 127.2% retracement target from the recent decline would take the SPY back to $146.50. The upper trend line resistance (line a) is in the $143.50 area. There is initial weekly support at last week’s low of $130.85.
The weekly on-balance volume (OBV) is back above its WMA, and a move above the resistance (line b) would be a bullish sign.
Nasdaq-100
The PowerShares QQQ Trust (QQQ) was hit hard on Thursday, reaching its lowest level in almost three weeks at $61.54 before turning around. This is now a pivotal level of support to watch.
There is still major resistance in the $64.50 to $64.80 area, which corresponds to the June highs. The 61.8% Fibonacci retracement resistance, calculated from the April high at $68.55, is at $65.32. A close above this level will be a good sign.
QQQ came close to the weekly Starc- band in May, and is now in the middle of the bands, with the weekly Starc+ band at $67 this week.
The weekly RS line is below its WMA, and is currently in a trading range. It will require close monitoring in the next few weeks, as tech is still one of my favorite sectors.
The weekly OBV is acting more positive, as it moved back above its WMA three weeks ago and is not far below the March highs. The OBV did confirm the recent highs, indicating that the major uptrend was intact.
The Nasdaq-100 A/D line (not shown) has overcome its downtrend, but has not yet accelerated to the upside.
Some of the tech stocks we have bought in the model portfolio in the past few weeks include Apple (AAPL), Microsoft (MSFT), Intel (INTC), and MicroChip Technology (MCHP), in addition to the Select Sector SPDR Technology ETF (XLK).
NEXT: Dow, Sector Focus, and Tom’s Outlook
|pagebreak|Dow Industrials
The SPDR Diamonds Trust (DIA) tested Tuesday’s lows at $124.25 on Thursday, before gapping sharply higher Friday. This is now the first important level of support.
The next resistance is at $128.71, as it has already surpassed the 61.8% retracement at $128.17. There is further chart resistance in the $129.60 to $130.30 area.
The weekly and daily relative performance, or RS analysis (not shown) still indicates that DIA is underperforming the S&P 500.
Russell 2000
The iShares Russell 2000 Index Fund (IWM) closed the week at $79.54, well above the mid-June highs at $79.08. This is a positive sign for the overall market.
The downtrend from the March and April highs is in the $80 area, with major resistance between $82 and $84.
The RS analysis improved sharply Friday, but does not yet indicate that the small caps are leading the S&P 500. The Russell 2000 A/D line (not shown) is rising more sharply, and is now closer to its long-term downtrend.
There is good support for IWM now in the $75.40 to $77.20 area.
Sector Focus
The iShares Dow Jones Transportation Average Index Fund (IYT) was up almost 2.5% on Friday, but is still below the June high at $94.57.
The Select Sector SPDR Health Care (XLV) and the Select Sector SPDR Consumer Staples (XLP) were the only two of the sector ETFs that have decisively moved above their mid-June highs last week.
The Select Sector SPDR Financials (XLF) was one of the best performers for the month, up 8%, while the Select Sector SPDR Energy (XLE) was up 6.4%.
We are currently long the Select Sector SPDR Health Care (XLV), and some of the health-care plays we have bought since the latter part of May are Abbott Labs (ABT), Amgen (AMGN), Eli Lilly (LLY), and iShares Nasdaq Biotechnology (IBB).
NEXT: Oil, Metals, and Tom’s Outlook
|pagebreak|Crude Oil
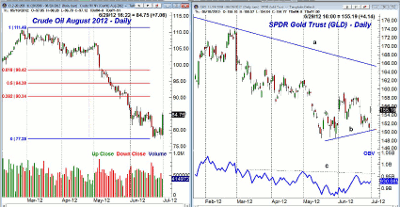
The August crude-oil contract hit a low of $77.28 last week, but for those who were short, the end of the week may have been painful as it closed up over $7 per barrel on Friday. Still, the daily chart shows that the major 38.2% retracement resistance from the March high is still much higher at $90.34.
It is likely that last week’s lows will hold for some time, but quite a bit of technical work needs to be done before the technical studies will confirm that a bottom is in place.
Precious Metals
The SPDR Gold Trust (GLD) was also strong Friday, closing up over $4, but it is still below the next major resistance in the $158.20 to $159.40 area. The long term downtrend (line a) waits in the $165 area.
GLD traded as low as $150.15 on Thursday, just reaching the second buy level at $150.28. The daily OBV pattern is looking more positive, and a move through the resistance (line c) would be a very bullish sign. The weekly OBV (not shown) is still locked in its several-month trading range.
The Week Ahead
This week action clearly supports the bullish case, but that does not mean one should buy anything at any price. If the market is now starting an intermediate-term uptrend, there are likely to be a number of corrections and periods when one sector falls out of favor and a new sector takes over leadership.
This should provide many buying opportunities for the patient investor who concentrates on the risk of each purchase. I would recommend that you not chase prices, but pick levels where the risk on any one position cannot seriously impact your portfolio.
Just as I commented two weeks ago, I still expect that sharp corrections will be buying opportunities, even though when the market is falling it can be tough to buy. Having your buy orders and stops already in the market can often make it easier.
I will be looking for new recommendations to make next week, especially in small-cap energy stocks. I will update the "Charts in Play" Portfolio on Monday and adjust stops accordingly.
Wishing you and your families a happy and safe Fourth of July.
- And don’t forget to read this week’s Trading Lesson, How to Get Started in Chart Reading

