After several weeks of declining stock prices, major averages are now close to major support. This relentless selling should be followed by some significant buying, but MoneyShow's Tom Aspray recommends that you stick with high-quality stocks that are performing better than the overall market.
It has been a punishing last six weeks or so in the stock market. The selling was pretty relentless all week, and early rally attempts fizzled quickly. I have been noting the deterioration in the technical picture since late March, when I warned: "The risk of a deeper correction remains high.”
Stocks continued to act pretty well during the month of April, but as the month came to a close, the enthusiasm over the earnings of Apple (AAPL) made me even more nervous about the market’s prospects. Adding to my concern were the upcoming elections in Europe, which had me wondering “Will Europe Spoil Apple’s Party?"
Now that the markets have answered the question, what can we expect in the coming months and what should investors be doing?
Though I will go into this in more detail later, one thing is for sure: I would not be buying Facebook (FB). Even though I have an (unused) Facebook page, I am not convinced it is worth $100 billion.
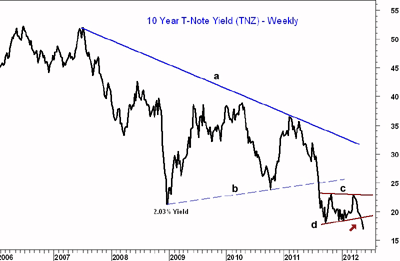
Despite the carnage in the stock market, Facebook’s IPO, and gold’s late rebound, the most striking development was in the bond market. The chart of the ten-year Treasury Note yield shows that they have dropped well below last September’s lows. They are well below the low seen in late 2008.
There are two main ways to interpret this action:
- The first is that this is a final washout in yields that will be followed by some stabilization and eventually a rise in rates.
- The other, more worrisome interpretation is that the completion of the trading range (lines b and c) is projecting an move to much lower rate, which will imply a much weaker stock market and economy. At this point, I feel this is unlikely.
US economic news last week was mixed. On the positive side, the outlook for housing continued to improve, with housing starts up 30% over the past year. Business inventory and industrial production figures also suggested that the economy was still growing.
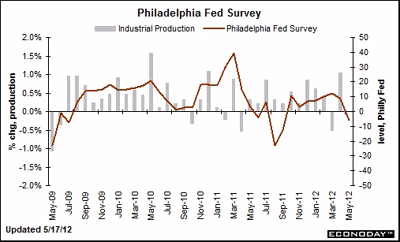
Retail sales dropped sharply from March, but were still positive, while there was mixed news on the manufacturing sector. The Empire State Manufacturing Report on Tuesday reflected a healthy increase last month. On Thursday, as the chart shows, the Philadelphia Fed Survey was negative, which damped the enthusiasm and increased the selling pressure.
This week, we get more news on housing, with existing home sales on Tuesday and new home sales this Wednesday. Also out Thursday are the latest numbers on durable-goods orders, as well as the weekly jobless claims.
On a global basis, there were some economic bright spots with surprisingly good GDP numbers. The Japanese economy grew at a 4.1% rate in the first quarter, Mexico was up 4.6%, and Singapore had an impressive growth rate of 10%, on the back of strong exports.
This week, the primary focus will again be on the Eurozone, as I do not expect anything dramatic from the G8 leaders after their weekend meeting. While most are wondering whether Greece will leave the euro, fresh concerns over Spain and Ireland surfaced late last week.
|pagebreak|WHAT TO WATCH
The short-term support for the Advance/Decline (A/D) lines was violated a day after the last Week Ahead column, which reinforced the negative technical outlook.
The drop in the A/D lines below the April lows, as I noted then, will “increase the chances of a sharper stock-market decline." As I discuss below, the A/D lines have plummeted even further, and are now at oversold levels. This increases the odds of a sharp rebound, which should come this week.
Individual investors have become more bearish, as the AAII survey shows that just 23.5% are now bullish, down from 45% in the middle of March. At the past lows in the summer of 2010 and 2011, this number was closer to 20%.
However, financial newsletter writers are still way too bullish to signal an end to the market’s decline, as over 39% are bullish and only 22% are bearish. This is likely to change dramatically this week.
If has been tough to make money since the start of April, as this chart illustrates. Those who bought bonds have done the best, as the iShares Barclays 20+ Year Treasury Bond Fund (TLT) is up over 10%. Even our somewhat late recommendation to buy TLT on May 7 is doing pretty well, up over 5%.
The dollar has also done well. The PowerShares DB US Dollar Index Bullish Fund (UUP) is up over 3%. Stocks as represented by the Spyder Trust (SPY) are down over 8%, and while the SPDR Gold Trust (GLD) bounced 3% from its lows last week, it is still down more than 5%.
The double-bottom formations in the inverse ETFs were completed on May 9, and since then they have had a nice run to the upside.
A rebound in the stock market is likely to take one of two forms:
- The first is that we will see just a two- to three-day rally that will be followed by a drop to new correction lows.
- The second is for an a-b-c rally that is likely to take a couple of weeks. This could take the S&P 500 back to the 1,340 area, if not higher. Given the extent of the market’s decline, this is the slightly favored scenario.
NEXT: Stock Analysis and Tom's Outlook
|pagebreak|S&P 500
The Spyder Trust (SPY) has closed lower for the past six trading sessions, and is getting closer to the major 38.2% Fibonacci retracement support from the October 2011 lows, at $128.90. I would expect a rally to develop from this level.
The A/D line violated its uptrend (line c) on May 7, and has plunged ever since. The gap between the A/D line and its WMA is quite large now. This indicates a very oversold market, and does favor a rebound.
Once a rally gets underway, the A/D line is likely to have trouble moving back above the April lows or its declining WMA. The SPY has initial resistance now at $132.50 to $133.50, followed by major levels in the $135 to $136 area.
Once a low is in place, I will be able to determine the key Fibonacci retracement levels that we should be watching.
Dow Industrials
The SPDR Diamonds Trust (DIA) broke support at $126.92 (line d) early last week, and the selling increased.
The weekly close below this level can be interpreted as completing a double-top formation. The next key support is major 38.2% Fibonacci retracement support at $122.
The DIA did make marginal new highs on May 1, as the Dow Industrials A/D line formed a clear negative divergence (line e). This was confirmed by the drop below the April lows. The A/D line is now closer to the uptrend from the 2010 lows. The Dow A/D line is also well below its WMA and is getting oversold.
The DIA has initial resistance now in the $126.50 to $128 area, and then around $130.
Nasdaq-100
The PowerShares QQQ Trust (QQQ) was hit hard last week, down 4.2%, as the major 38.2% Fibonacci support at $61.48 was broken. The uptrend that goes back to last fall (line b) has also been violated.
Retracement analysis now indicates that QQQ will now drop to the 50% support level at $59.22. (For more on Fibonacci, read “Fibonacci Analysis: Master the Basics.”)
The Nasdaq-100 Advance/Decline (A/D) line formed a negative divergence at the April 2 highs, then dropped below the April lows on May 7. The fact that the A/D line had started to act weaker than prices was a negative sign. Last fall, when the tech sector was leading the market higher, the A/D line was acting stronger than prices.
The A/D line has also now broken its uptrend from last year’s lows (line b), confirming the price action.
There is initial resistance near $63, with stronger levels between $64 and $64.50, and then the declining 20-day EMA.
Russell 2000
The iShares Russell 2000 Index Fund (IWM) completed its head-and-shoulders top formation last week, when it closed below the neckline. The downside target from the H&S top is in the $71.40 to $72 area.
The Russell 2000 A/D line peaked first in February, and then formed a series of lower highs (line e). This is consistent with a weak market.
First resistance now stands in the $76 to $77 area.
NEXT: Sector Focus, Commodities, and Tom's Outlook
|pagebreak|Sector Focus
This chart of some of the Select Sector SPDRs reflects their performance so far in 2012. The Select Sector SPDR Technology (XLK) is now up just over 6% for the year, a massive drop from being up almost 18% in early April.
Meanwhile, the Select Sector SPDR Industrials (XLI) have dropped into negative territory, and the benchmark Spyder Trust (SPY) is up just 1.6%. The Select Sector SPDR Utilities (XLU) moved back into positive territory in the latter part of April, crossing above the XLI.
The Select Sector SPDR Consumer Discretionary (XLY), Select Sector SPDR Health Care (XLV), and Select Sector SPDR Consumer Staples (XLP) are holding up much better. Some drug stocks, like Pfizer (PFE), have held firm during the market’s decline, and should be star performers once the market bottoms.
Crude Oil
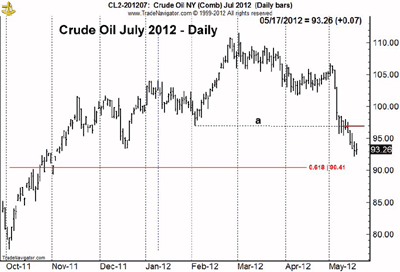
The July crude oil contract completed its top formation almost two weeks ago, when it dropped below support (line a). It has also now broken the 50% Fibonacci support from the October lows.
The next level to watch is the key 61.8% retracement support (0.618) at $90.41. I will be watching the action in crude oil closely, as it is likely to bottom ahead of stocks.
Precious Metals
The SPDR Gold Trust (GLD) has rebounded impressively from the week's lows. But as I discussed in detail earlier today, the weekly and daily volume does not yet suggest a bottom is in place.
The iShares Silver Trust (SLV) has also bounced from its lows, but faces heavy resistance not too far above current levels.
The Week Ahead
The selling on Thursday had some signs of panic liquidation, but the market failed to rally Friday. It gave up early gains, and the major averages closed near their lows.
This selling has stopped us out of many of the positions in the Charts in Play portfolio, but in most cases the stocks have moved even lower. Over the past six weeks, I had continually raised my stops to lock in profits and reduce the risk on the portfolio. Unfortunately, my buy zones to add to positions in the inverse ETFs were never reached.
Despite the market decline, I would still expect the stock market to close the year well above current levels. Therefore, I am not favoring the Treasury market for the cash in the portfolio, but instead will be looking for stocks with attractive yields that are acting stronger than the overall market. Many of the stocks in the current portfolio have just those characteristics.
- To view the current Charts in Play portfolio, click here.


