Despite recent gains, critical market internals suggest the correction is not yet over, but more upside earnings surprises could be just what is needed to turn momentum decisively positive.
The stock market put in a positive performance this past week, as Friday’s gains pushed stocks into positive territory. This was a pleasant surprise after the prior week’s decline, which was the S&P 500’s largest drop of the year so far.
There were quite a few wide swings during the week, as Monday’s large-cap gains were not matched by the Nasdaq, which was down 0.76% on the day due to the losses sustained by Apple Inc. (AAPL) shares. All the major averages were strong on Tuesday with the Dow Industrials closing back above 13,000.
However, the story changed on Wednesday and Thursday, when the market gave up the gains of the prior two days and the S&P 500 came very close to key support before late buying pushed the market higher.
It certainly has been a battle between the buyers and sellers, but stronger-than-expected earnings have made all the difference. According to Bloomberg, well over 80% of the reporting companies have beaten analyst estimates. This has clearly encouraged new buying, and earnings from Microsoft Corp. (MSFT) announced after the close on Thursday gave the market a boost on Friday, a day on which MSFT was up almost 6%.
See also: 3 Ways to Predict Post-Earnings Shocks
Despite the stock market gains, market internals like the Advance/Decline (A/D) line (see below) have not yet signaled that the correction is over. A sharply lower close early this week could reverse the positive momentum carried in from the prior week, but if earnings continue to be strong, that could be enough to reverse the recent deterioration.
Over the years, I have found that the technical readings do a better job of forecasting stock prices than counting on the earning reports.
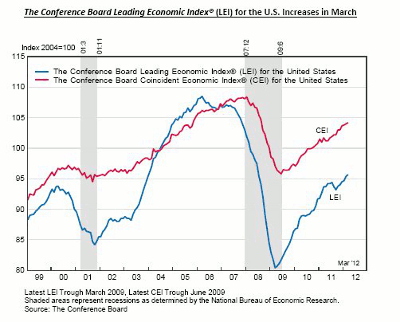
Strong earnings were helped by some encouraging data, as the Conference Board’s Leading Economic Indicators (LEI) put in a strong performance. The chart shows that both the LEI and the Coincident Economic Indicators (CEI) are sharply rising and have been since the 2009 low.
It is interesting to note that the LEI peaked in 2006 and had started to roll over in 2007 even though the CEI was still rising. The strong uptrend in both the LEI and CEI suggests that there are no signs of a recession on the horizon.
NEXT: Some Important Warning Signs About the US Economy
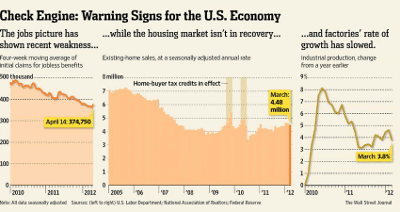
|pagebreak|Not all of the news last week was positive despite better-than-expected retail sales numbers. Other economic news concerned investors, as this excellent graphic from the Wall Street Journal indicates. The jobless claims data has deteriorated over the past few weeks, which, after March’s disappointing monthly job report, is not a good sign.
The existing home sales data also discouraged investors, as did the unchanged report on March Industrial Production. Most were expecting a slight gain.
More news on housing will come on Tuesday when the S&P/Case-Shiller Housing Price Index and new home sales data is due out. This will be followed on Thursday by the pending home sales index.
This is quite a busy week for economic data, as the FOMC meeting starts on Tuesday, the same day the April Consumer Confidence report will be released. Durable goods are out on Wednesday, as is the FOMC meeting announcement, which will be followed by Fed Chairman Ben Bernanke’s press conference.
Thursday brings weekly jobless claims, which may get more attention than normal this week. That will be followed Friday by the advance reading on first-quarter GDP, the employment cost index, and the latest reading on consumer sentiment from the University of Michigan.
The market was relieved this past week when the Spanish bond auctions went better than expected, although the European debt crisis remains a wild card in the markets. The number of delinquent loans at Spanish banks hit a 17-year high last week, and it is being reported that Eurozone banks have already used most of the cash that was provided by the European Central Bank (ECB).
To make matters worse, the ECB seems reluctant to provide additional cash at the moment, and the Bank’s role is being hotly contested in the first round of French Presidential elections being held over the weekend. Also, despite the auction results, yields on Spanish bonds started to rise again on Friday.
WHAT TO WATCH
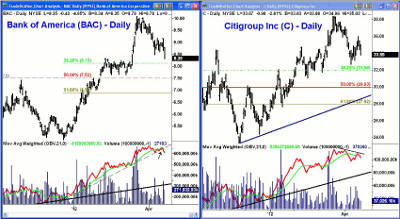
Though the major averages closed higher on Friday and positive for the week, they remained well below the day’s highs. Some important stocks were bucking the trend, however, and two of the big banks, Bank of America (BAC) and Citigroup Inc. (C), both closed lower for the day.
The daily charts for both bank stocks look negative, and BAC appears ready to drop to the 38.2% support at $8.13, if not the 50% support at $7.52. Volume was not heavy in BAC on Friday, but the on-balance volume (OBV) has broken its uptrend.
Citigroup Inc. (C) could easily drop back to the 38.2% support at $31.94, which is about 6% below Friday’s close. The OBV for Citigroup looks even more negative and could start to lead prices lower.
The A/D numbers oscillated back and forth last week, but overall, they had a slightly positive bias. As I mentioned here on Thursday, the patterns do suggest another market decline. The confirmation will come if the A/D line breaks below last week’s lows. If that occurs, the selling could clearly pick up.
The sentiment numbers are still too bullish for my liking, and the equity put-call ratios are in the sell mode, according to option expert Larry McMillan. The failure of the major averages to move through key resistance last week clearly suggests that the market is still vulnerable.
NEXT: Latest Outlook for S&P 500, Dow Industrials, and Other Major Indices
|pagebreak|S&P 500
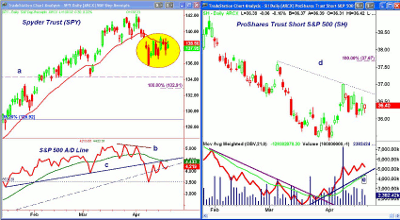
The Spyder Trust (SPY), which follows the S&P 500, managed minor gains by the close on Friday, and the trading over the past two weeks (highlighted in yellow) still could be a continuation pattern or a pause in the decline from the early-April highs.
A drop below the support at $136.58 would turn the focus again to the downside, and a break of the April 10 lows at $135.76 would signal a drop to the May lows at $134.36, line a.
If the next decline is equal to the initial drop from the April highs, then the Fibonacci price projection, or equality target, for SPY is at $132.91. There is major support in the $128.90-$130 area.
The A/D line did form a negative divergence at the recent highs (line b) and needs to move back above its former uptrend, line c, and its weighted moving average (WMA) to improve. A move through the downtrend, line b, will signal a resumption of the intermediate term uptrend.
The S&P 500 A/D line is still in an uptrend, but one day of sharply negative A/D numbers could turn it negative. A drop below the April lows in the A/D line would signal a deeper correction.
There is first resistance for SPY at $139.36, and move above $140 would improve the outlook.
On Thursday, I recommended the ProShares Short S&P 500 ETF (SH). Despite Friday’s rally, it still looks positive, and the initial buying zone was hit. The rally from the April lows in SH was accompanied by strong volume, as the OBV is in a clear uptrend, line e. A close above the downtrend at $36.80, line d, would signal a further rally.
Dow Industrials
The SPDR Diamonds Trust (DIA), which tracks the Dow Industrials, did manage to move back above its 20-day exponential moving average (EMA) and the resistance at $130 last week. DIA is acting somewhat better than the S&P, as nervous investors have been favoring the large-cap stocks.
The Dow Industrials’ A/D line is also in a short-term uptrend but is below its weighted moving average and its former uptrend.
There is minor support now at $128.80 with more important support in the $128 area. On a break below the April 10 lows at $126.92, the 38.2% Fibonacci retracement support from the October 2011 lows is next at $121.57.
Russell 2000
The iShares Russell 2000 Index Fund (IWM) is still acting weak, as it failed on Friday to move above Thursday’s highs. A drop below short-term support at $79.26 would weaken the outlook, and more important support is now at $78.
The Russell 2000 A/D line is still below its declining weighted moving average and well below the bearish divergence resistance from the February and March highs. IWM now has resistance in the $81.50-$82 area, and then at $83.50.
NEXT: Nasdaq 100, Key Sector ETFs, Gold, and Treasuries
|pagebreak|Nasdaq-100
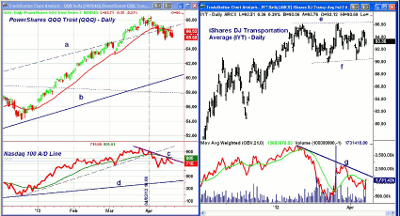
The PowerShares QQQ Trust (QQQ), which tracks the Nasdaq 100 Index, made several attempts to push convincingly above the $67-$67.30 level last week, but failed each time. The chart shows that prices failed at the upper boundaries of the trading channel, line a.
QQQ closed a bit lower on Friday, and there is now short-term support at $65.20. If this level is broken, the next good level of support is in the $63-$64.50 area.
The Nasdaq 100 Advance/Decline (A/D) line is barely in an uptrend, as it turned lower after testing its negative divergence resistance (line c) and its declining weighted moving average. A lower close early in the week could generate another sell signal.
Sector Focus
The iShares Dow Jones Transportation ETF (IYT) has started to act stronger after topping in early February. The daily chart shows a trading range (lines e and f) that looks like a continuation pattern, not a top. The OBV is trying to turn up, and a move through resistance at line g would be positive.
Both the Select Sector SPDR - Consumer Staples (XLP) and the Select Sector SPDR - Health Care (XLV) had good weeks, as both were up over 1.5%. These were followed by the Select Sector SPDR - Utilities (XLU), which was up almost 1%.
The other major sector ETFs are still in short-term downtrends, and as I discussed here earlier Friday, the Select Sector SPDR - Energy (XLE) still looks vulnerable to a further decline. I also discussed the daily top in the futures for unleaded gas, which suggests consumers could finally see some relief from high gas prices.
Interest Rates
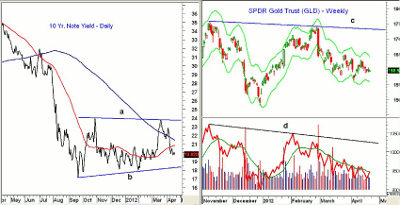
The yield on the ten-year Treasury note has dropped back below the 2% level after hitting a high of 2.33% in the middle of March. Though rates still may be bottoming, the yield chart is looking more like it is forming a continuation pattern.
This would mean that the action since September is just an interruption, or pause, in the overall trend of lower yields. There is key support now at 1.79%, and if broken, it would signal a further decline in yields.
Conversely, a convincing close above the March highs, line a, would signal a rise in yields to 2.8%-3%.
Precious Metals
The SPDR Gold Trust (GLD) traded in a fairly narrow range last week with a slight downward bias. There now seems to be much less interest in gold, which is just what’s needed before a bottom can be formed.
The criteria for a bottom in GLD (see "Gold: 3 Signs Will Confirm the Bottom) have not yet been met, as the OBV still has major resistance at the downtrend, line d. There is building resistance now in the $165-$166 area, which I am watching closely while the market seems to be sold out.
The ranges in the iShares Silver Trust (SLV) have also narrowed, but there are no signs yet that it has completed a bottom.
The Week Ahead
The action last week was not as volatile as I expected, and my analysis suggests that the market is vulnerable to a further decline. That still seems likely, although the action early in the week could prove me wrong.
I have continued to raise stops in the “Charts in Play” portfolio, which has reduced the overall equity portfolio, and several stops have been hit. Several of the holdings continue to look good, and the largest holding, Coca-Cola Company (KO), had a great week, gaining 2.3%.
Since I feel that the risk for a sharper decline is still quite high, I recommend hedging by buying an inverse ETF with a fairly tight stop. For those who are anxious to buy, a deeper decline should provide a much better entry point on the long side. Keeping a good level of cash so you can conduct new buying at lower levels seems to be a prudent strategy at this time.
To view the current “Charts in Play” portfolio and updated stop levels, please click here.
Also, don’t forget to read this week’s Trading Lesson, “3 Ways to Predict Post-Earnings Shocks.”

