The rough week has caused quite a bit of damage, and a deeper correction is likely. It pays to be defensive right now, but there are some high points, writes MoneyShow senior editor Tom Aspray.
Last week was a rollercoaster ride in the markets, as stocks opened Monday under pressure from the previous Friday’s weaker than expected jobs numbers. This selling was exacerbated Tuesday when some of the European markets reopened and also started to sell off.
By the close on Tuesday, it seemed as though the remarkably positive first quarter was just a nice dream. Pessimism over the economy and stocks increased. Spiking yields in both Spanish and Italian bonds renewed fears of a Eurozone contagion. China bears were out in force.
But then the US market opened Wednesday as if it had been fully medicated, and closed sharply higher. Alcoa’s (AA) earnings after the close Tuesday helped, as did a positive response to the Spanish bond auction. The party continued Thursday, as rumors of a much better GDP number from China helped fuel further gains.
After the two-day binge, the hangover began on Friday. Stocks closed lower, and the weaker than expected GDP numbers from China did not help.
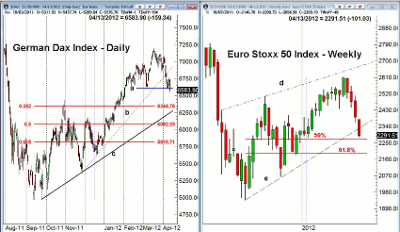
Of greater concern to me on Friday was the technical damage done in some of the overseas markets. The German Dax lost 2.3%, closing below both the week’s early lows and the support from early March (line a). The Dax had topped out in mid-March, and broke its uptrend (line b) just before the Easter holiday.
The 38.2% Fibonacci retracement support is at 6,348, which is 3.5% below Friday’s close. The uptrend from the September 2011 lows (line c) is now at 6,250. Of course, Germany is the strongest of the Eurozone countries, so this weakness is troubling
The chart of the Euro Stoxx 50, the Eurozone blue-chip average, confirms this weakness, as it has broken its uptrend from last fall’s lows and completed its flag formation. The 50% Fibonacci support is just below Friday’s close at 2,271, with the 61.8% support to follow at 2,191. If this level is broken, a drop back to last year’s lows cannot be ruled out.
As I will discuss in more detail later, there has also been technical damage in the US market. A drop below last week’s lows could start new downtrends in the Advance/Decline lines, which are not far above their next level of support.
Another concern, of course, is the onset of the earnings season, as the reporting calendar is heavy for the next few weeks. Late last week, Google (GOOG), JPMorgan Chase (JPM), and Wells Fargo (WFC) all reported better than expected earnings, and all declined Friday. Google fell over 4%.
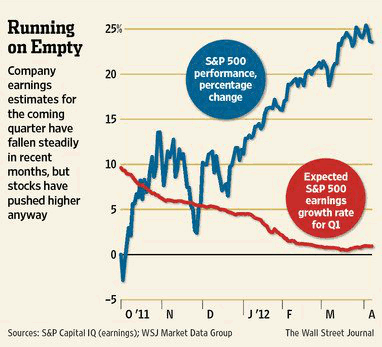
In case investors did not have enough to worry about, this chart from The Wall Street Journal shows that analysts have been steadily lowering their earnings estimates for the quarter and the year.
Standard and Poor’s reports that only industrials, technology, and consumer staples are expected to show an increase in earnings for the first quarter. On the other hand, financial stocks are expected to show the best earnings growth in 2012. This correlates with the technical outlook that suggests a decent correction in the banks should be a good buying opportunity.
Many of the housing stocks tested first good support last week. We get plenty of news on the housing front this week, with the Housing Market Index on Monday, housing starts on Tuesday, and then existing home sales on Thursday.
Also, the latest numbers on retail sales will be released Monday, followed Tuesday by industrial production figures. On Thursday, we get Leading Indicators, the Philadelphia Fed survey, and the latest jobless claims.
The Euro debt crisis could shake the markets again this week, as both Italian and Spanish bond yields rose late in the week. It was also reported that Spain’s borrowing from the ECB reached a new high in March.
On the plus side, there were comments Friday from the IMF’s Christine Lagarde that the prospects for global growth have improved, and they are better now than they were a just a few months ago.
|pagebreak|WHAT TO WATCH
The April jobs report has certainly put the market on the defensive once more. As I noted on March 30, “I have been concerned that we could see a disappointing monthly jobs report in the not-too-distant future, and that could come this week.”
With the action of the past two weeks, the main question now is whether we will just see a drop back to last week’s lows for the S&P 500, in the 1,360 area, or whether those lows will be violated. If they are broken, the March lows at 1,340 will be the next downside target.
The fact that the Dax as well as the Euro Stoxx 50 have already broken below their March lows makes a deeper correction more likely. This is consistent with the deterioration in the Advance/Decline (A/D) lines for the major averages, as discussed below.
The sentiment has already started to turn more negative, as only 28% of individual investors in the AAII survey remain bullishâ€"a 10% drop in the past week. Newsletter writers are still too positive; 48% are bullish. But this number should change this week.
The recent action does not change the major trend, but another couple of weeks of sideways to lower price action is now more likely.
S&P 500
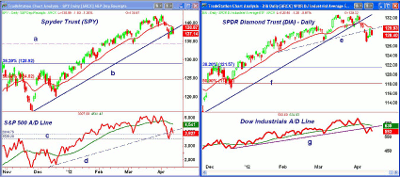
The Spyder Trust (SPY) closed below its daily uptrend (line a) last Tuesday, reaching a low of $135.76.
This is the key level to watch, and if it is broken the next support is at $134.36 to $133.84. A decisive close under this level will suggest a drop down to the 38.2% Fibonacci retracement support level at $128.92.
The S&P 500 A/D line has really dropped sharply, violating its recent lows, its WMA, and the uptrend (line d). It did turn up last week from the next good level of support (line c).
The A/D line turned down again Friday, suggesting that the rally last week was just an oversold bounce. A drop below the prior lows will start a new downtrend and signal a deeper correction. A day of strong A/D numbers early this week is needed to stabilize the A/D line.
The resistance at the flat 20-day EMA in the $138.90 area stalled the rally last week. Further resistance stands at $140.
Dow Industrials
The SPDR Diamonds Trust (DIA) has bounced from support at $127, meaning it did violate the early March lows. On last week’s rebound, it also failed to move back above its 20-day EMA and the resistance at $130.
The Dow Industrials A/D line looks weaker than the S&P 500, as it just rebounded to its former uptrend (line g) last week. It could easily drop below the recent lows on a down day early in the week.
On a drop below $127, there is further support now at $125, with the 38.2% Fibonacci retracement support from the October 2011 lows next at $121.57.
NEXT: Nasdaq, Sector Focus, and Tom’s Outlook
|pagebreak|Nasdaq-100
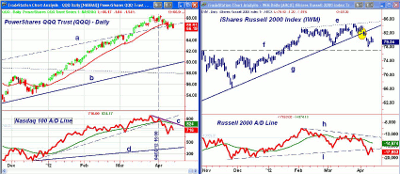
The PowerShares QQQ Trust (QQQ) has held up better than the DIA or the SPY, and the $66 area represents first support. If it is broken, the next major support is at $64.50 and then in the $63 area.
The Nasdaq-100 Advance/Decline (A/D) line formed a negative divergence (line e) at the April 2 highs. Two days later, it dropped sharply and fell well below its uptrend and its WMA.
It was also a sign of weakness that March lows were broken. This warns of further weakness, as the A/D line is now acting weaker than prices. The next strong support for the A/D line is at line d.
The first meaningful resistance is now far above Friday’s close, in the $67.50 to $68.40 range.
Russell 2000
The iShares Russell 2000 Index Fund (IWM) broke its uptrend (line g) just before the Easter holiday. So far, IWM is still holding above the key support in the $77 area (line f). If it is broken, the next area of support is in the $74 to $75 area.
The Russell 2000 A/D line has been diverging from prices for a few weeks, as while prices made higher highs (line e), the A/D line was making lower highs (line h). The drop in the A/D line below support (line i) suggests that small caps are likely to continue to underperform.
There is resistance now for IWM in the $82 area, then at the former uptrend (line g).
Sector Focus
I am still closely watching the iShares Dow Jones Transportation ETF (IYT), as it has been locked in a broad trading range since it peaked in early February.
Though this could be a top, it does look more like a continuation pattern, which has more positive implications. Key support in the $90 area and a close above $96.30 is needed for an upside breakout.
The Select Sector SPDR Energy (XLE) has been the weakest sector, down about 4.8% in the past two weeks. Clearly it has been weaker than I expected, and while lower oil prices are a plus for the economy, the long-term fundamentals do unfortunately favor more expensive crude.

I found this chart of China’s annual oil imports quite interesting, as it has gone from just over one million barrels in 2000 to almost 6 million this year. Looking at this chart, it is easy to see why crude oil and gasoline are so expensive.
That is why I cringe when even the supposedly business-savvy politicians blame crude prices on any politician. This trend clearly indicates that with the current rate of crude oil consumption, our next president will also be facing higher energy prices.
The sectors that have held up the best over the past two weeks are the Select Sector SPDR Consumer Staples (XLP), down 1%, and the Select Sector SPDR Consumer Discretionary (XLY), down 1.5%. The normally defensive Select Sector SPDR Health Care (XLV) has been weaker than I would have expected, falling 2.6%.
NEXT: Oil, Gold, and Tom’s Outlook
|pagebreak|Crude Oil
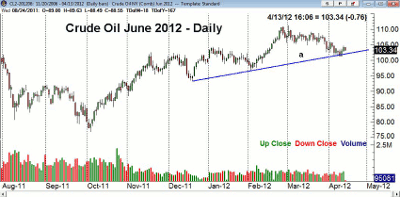
Crude oil, basis the June contract, has dropped down to test the uptrend from the December low (line a).
A drop below the support at $100 would definitely get the market’s attention, and if it occurs it will be interesting to see how the transportation stocks respond.
Precious Metals
The SPDR Gold Trust (GLD) also closed weak on Friday after rebounding to resistance in the $163 area. The pattern of lower highs and lower lows is still intact.
I am still looking for another drop before a bottom is in place, but as I outlined last week in "Gold: 3 Signs Will Confirm the Bottom," there are some specific signs that should indicate this has happened.
The iShares Silver Trust (SLV) is looking more negative once again. A break of the $30 support could trigger some serious selling, and drop SLV back to the $26 to $27 area.
The Week Ahead
In my last column, I laid out two scenarios: one was for an upside breakout, and the other discussed the implication of “a sharp down day on worse than three-to-one negative A/D numbers."
Unfortunately, the latter is what occurred, and are now seeing the deeper correction that it was forecasting. I cautioned that if we did see an upside breakout, it should be seen as an opportunity to sell.
So what to do now? Clearly, I believe the action early this week will likely set the tone for the next week or two.
It is important that you have stops in place. While we may only see another 2% to 3% decline, there is a chance we will lose another 5%. That is why it is important to determine stops on your positions when the markets are closed, so you do not get caught up in the emotion of a declining market.
A number of the positions in my model portfolio have been stopped out, and I will likely be adjusting stops again early this week.
- For a current review of the portfolio and stops, please click here.
- Don’t forget to read my latest Trading Lesson, Catch Major Trends with Monthly Charts.

