Economic news from China last week overshadowed improving technicals for in many parts of the market, including the specific areas highlighted by MoneyShow senior editor Tom Aspray.
Stocks took a breather last week, as fears over a slowing Chinese economy scared some out of stocks as well as crude oil, which dropped sharply. The latest data on manufacturing from both China and Europe spooked some investors.
Several weeks ago, Chinese Premier Wen had cut the GDP target to 7.5% for 2012, from 8% in 2011. But only a week later, Nomura Securities raised their forecast from 7.9% to 8.2%. In their opinion, further lowering of interest rates and the bank reserve requirement will turn the economy around.

Though China’s GDP growth is well below the 14% high in 2007, their growth is still clearly the envy of the world. Many are expecting a further collapse of real-estate prices to crush the economy. In my view, it is unlikely that after working so hard to make China an world economic power, leaders will let the economy crash
The purging of party secretary Bo Xilai and the efforts to block Internet searches of his name have raised concerns over political infighting as well as unfounded rumors of a coup. It seems unlikely that this will have any lasting impact on the government.
It was also reported last week that government officials privately contacted fund managers to let them know that capital restrictions would be relaxed which would make it easier to invest in the Chinese stock market.
It was a rough week for the Asian stock markets. Shanghai, Hong Kong, and Japan posted their worst weekly losses for 2012.
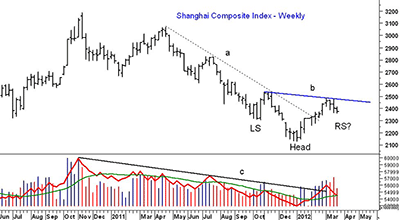
The Shanghai Composite broke its weekly downtrend (line a) in early February, but has declined 4.5% over the past three weeks. It is still up 6.8% so far in 2012. Volume improved early in 2012 as the on-balance-volume broke its downtrend (line c).
Technically, the Shanghai Composite may be bottoming. If it can hold the 2,300 level and then turn higher, it could be forming a reverse head & shoulders bottom formation.
A close above the resistance at 2,500 (line b) would then signal a move to the 2,800 to 2,900 area. Clearly, this is a market that should be watched over the next month
The sharp increase in interest rates here and in Germany has also gotten the market's attention. The yield on the German bunds rose 18% in just a week, suggesting they may no longer be a safe haven. The bunds' stability had been a plus for Eurozone banks. The yields came back down late last week as they did in the US, but as I mentioned several weeks ago, yields do appear to be bottoming out.
Last week’s minor sell-off gave the bears a chance to again question the current level of stock prices, as some think stocks will not move much higher for the rest of the year. This was not the case for Goldman Sachs, which came out with a research report arguing that equities should perform better than bonds over the next few years.
As I have commented before, many market veterans—myself included—are often skeptical about the true goals of their research reports. It has often been suspected that they are saying one thing but doing another.
This fits in nicely with the current PR nightmare over their ex-employee’s recent editorial. One has to wonder this time whether they are just trying to encourage their institutional clients or “muppets” to buy their stocks at the current elevated levels.
This week marks the end of the quarter, which often has a positive bias for stock prices. In may be a battle this time between those who are selling to lock in profits and those who are trying to dress up their portfolios.
There is a full slate of economic reports this week that will give investors plenty to think about. On Monday, we get pending home sales and the Dallas Fed Manufacturing Survey. Tuesday, we get more on the housing market with the S&P Case-Shiller Home Price Index, as well as the Conference Board’s latest reading on consumer confidence.
February durable goods orders are out on Wednesday, followed by the GDP and jobless claims on Thursday. Then, on the last trading day of the quarter, we get personal income, the Chicago purchasing managers' report, and the University of Michigan’s Consumer Sentiment Report.
|pagebreak|WHAT TO WATCH
The major averages closed the week mixed, but did bounce on Friday, raising the possibility that the slight correction is already over. The Powershares QQQ Trust (QQQ) was able to close the week higher, and technical readings of the major averages remain positive.
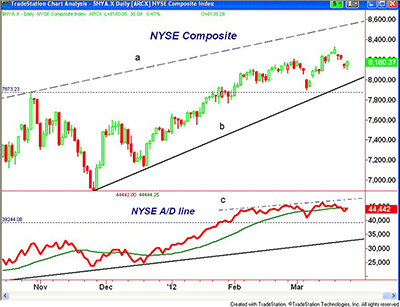
The chart of the NYSE Composite shows Friday’s strong close, suggesting that last Monday’s highs are ready to be tested. The action Monday, which may depend on the overseas markets, will tell us more.
Though the Advance/Decline line on the NYSE Composite does show a pattern of higher highs (line c), it did not make a new high last Monday. The A/D line has turned up, and positive A/D numbers Monday should move it back above its WMA, consistent with a resumption of the uptrend.
Very negative A/D numbers will suggest that the uptrend (line b) in the 8,000 area will be tested. There is long-term trend line resistance (line a) around 8,600.
Market sentiment did not change much last week. While financial newsletter writers turned a bit more positive on the market, the AAII sentiment numbers showed a 3% decline in the number of bulls. Neither reading is giving particularly strong signals at this time.
S&P 500
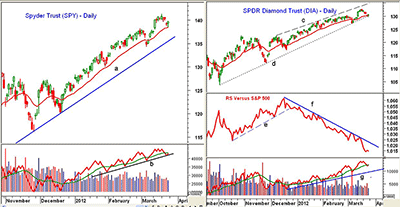
The Spyder Trust (SPY) dropped down to test the rising 20-day EMA at $138.26 on Friday before rallying to close higher. A move above the $140.65 level should signal a resumption of the uptrend, with next targets in the $141.80 to $142 area.
There is still a major Fibonacci projection target at $145.27.
Last week’s action did relieve some of the short-term overbought status, as it had reached its Starc+ band the prior week. There is a band of support now between $136 and $138 with the key support level still at $134.26. The SPY is still holding well above the uptrend from the October lows (line a).
The S&P 500 A/D line (not shown) did make new highs last week and the OBV did confirm the recent price action. The OBV has turned up from its support (line b), and a move back above its WMA would be positive.
Dow Industrials
The SPDR Diamonds Trust (DIA) tested its uptrend from the October lows (line d) last Friday, before closing back above its 20-day EMA. If DIA can get back above $132.60, it could run to the upper trend line, which is near $134 (line c).
The relative performance is still in a well-defined downtrend (line f) as DIA is still acting weaker than the S&P 500 or the SPY. The break of the uptrend in December (line e) indicated a change in leadership.
There is minor support now around $129.50 and the 20-day EMA, with stronger support now at $127 to $128.50. It would take a break below $127.18 to signal that a deeper correction is underway.
The Dow Industrials A/D line (not shown) is starting to act stronger, as it has held above its rising WMA and it did confirm the recent highs. This may be an early sign that investors are once again moving to the more defensive large-cap stocks.
NEXT: Nasdaq, Sector Focus, and Tom's Outlook
|pagebreak|Nasdaq-100
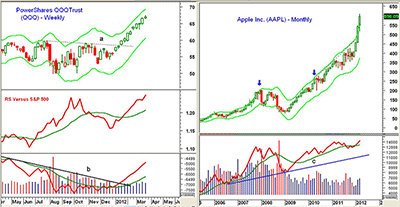
The PowerShares QQQ Trust (QQQ) was able to exceed the next Fibonacci price target of $67.15 last week. The weekly Starc+ band this week is at $69.30.
Relative performance analysis continues to indicate that the Nasdaq is outperforming the S&P 500 as it made further new highs last week and is well above its rising WMA.
The weekly OBV also is acting very strong after breaking its downtrend in January (line b). This confirmed the move through the chart resistance (line a).
The Nasdaq-100 Advance/Decline (A/D) line (not shown) continues to hold well above its rising WMA
There is initial support now at $66 to $66.50, with the 20-day EMA at $65.62. The majority of stops are now likely under the recent low of $63.23.
The techs have been propelled higher by the action of Apple (AAPL), which has traded for most of the past two months above the monthly Starc+ band. As it turned out for gold last summer, this is sending a strong warning, even though there are no signs yet of a top. The blue arrows highlight previous times that AAPL traded above its monthly Starc+ band.
The monthly and weekly OBV continue to look positive with no signs of topping yet. Still, with the analysts raising their price target higher and higher, it does make me cautious.
Russell 2000
The iShares Russell 2000 Index Fund (IWM) was underperforming most of last week, but also rebounded nicely on Friday. It needs a strong close above $84.40 to turn the chart bullish.
The Russell 2000 A/D line (not shown) still is in a downtrend from the February highs, and this needs to be broken in order to turn the technical picture positive.
Initial support now sits at $81 to $81.30, with more important levels between $79.50 and $80.
Sector Focus
The Select Sector SPDR Financial (XLF) tested support at $71.50 last week before rallying. It still looks positive.
The Select Sector SPDR Energy (XLE) turned lower early last week, and gapped lower on Thursday, taking it back to more important support in the $71 area. To keep my positive view intact, it will need to put in a strong performance this week.
My buying levels were hit in the two refiners I recommended on March 14, while two of my other oil holdings were stopped out. The refiners are still in clear uptrend and should now move back above the previous highs.
The Sector SPDR Consumer Staples (XLP) closed at new rally highs last week, and the Sector SPDR Consumer Discretionary (XLY) also held up well.
NEXT: Oil, Metals, and Tom's Outlook
|pagebreak|Crude Oil
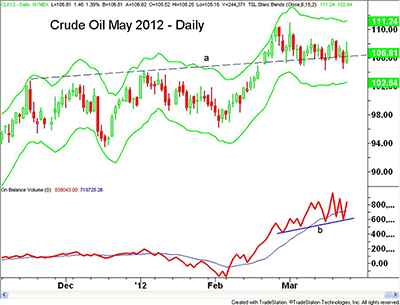
Crude oil, basis the May contract, was hit hard last week. It dropped from Monday’s high of $108.70 to a low of $104.50 on Thursday. Still, the daily chart shows that it is still in a broad trading range, as it continues to test the breakout level (line a).
A close above $109 should confirm a resumption of crude’s uptrend, with the next resistance in the $110 to $111 range. The next major upside targets from the flag formation are in the $115 to $116 area.
Precious Metals
The SPDR Gold Trust (GLD) gapped higher on Friday, but is still in a downtrend. The sentiment picture discussed last week still suggests that we need to see further weakness and a drop back to stronger support before gold can bottom out.
The buying zones I identified could be hit in the next few weeks, but currently there are no signs yet that the decline is over. The drop in demand from India and proposed new taxes are likely to also weigh on prices.
The iShares Silver Trust (SLV) has bounced from the support around $30, but still faces strong resistance in the $32 to $33 area.
The Week Ahead
I would look for prices to move higher this week despite the economic reports, as the technical action continues to look positive. It does not look explosive like it did at the start of the year.
I would continue recommend that investors lock in profits on existing long positions, and have stops in place for all positions. The market becomes more vulnerable as it moves higher without a significant correction.
I would look for yields to come back down in the next few weeks, and those who are worried about having too heavy a position in the bond market should look to reduce their exposure. There are signs that yields are bottoming and a move in the 30 Year T-Bond yield above 3.45% could cause a rush for the exits.
- In this week’s Trading Lesson, “Steps for Finding the Next Winning Stock,” I go in to detail on the five step process that I use to identify and invest in what are often tomorrow’s hit stocks.
- Also, click here for an update on the Charts in Play portfolio as of last Thursday’s close.

