The warning flags are up, and time is running out for a solid rally. Be careful, and watch these key indicators over the next few weeks to see where the wind is blowing, writes MoneyShow.com senior editor Tom Aspray.
Friday’s final triple-witching day of 2011 was pretty quiet overall. Despite generally good news for the US economy, stocks closed lower for the week. This makes me wonder whether the Grinch has already made his bet that stocks will finish the year on a weak note.
The short-term technical picture has deteriorated, and as I discuss later, it could turn negative early this coming week if stocks fail to mount a good rally. Analysis of the Volatility Index (also known as the "fear index") both in the US and in Europe suggests that even the most strident bears are not expecting the market to plunge going into the end of the year.
Some measures of the Euro debt crisis actually improved last week, even though many are still concerned that the recent central bank action and summit agreement may not be enough. IMF head Christine Lagarde did not paint an optimistic picture of the global economy on Friday, forcefully arguing that all countries needed to help Europe in order to avert an even worse financial crisis.
In an interesting Bloomberg TV interview, legendary interest-rate expert Jim Grant dispelled that notion that European central banks are doing little, as in reality they are printing massive amounts of money. Grant said that “in Switzerland, the Swiss National Bank has been growing its assets over the past three months at a rate of in excess of 300%.”
If this is indeed a global trend, then the longer-term inflation implications are huge—but investors should also realize that a gradual rise in the rate of inflation is bullish for the stock market.
Clearly, last week’s US inflation numbers were weaker than expected, and there's no sign yet of a major rise on the horizon. Many are more worried about deflation, like what has crushed the Japanese economy since its stock market peaked in 1989.
Last week’s action in the gold market certainly did not reflect inflationary fears. The SPDR Gold Trust (GLD) was down over 7% for the week. I had warned beginning in August that gold was quite vulnerable to a sharp decline, based on Starc bands as well as my long experience in the gold market that it was quite vulnerable to a sharp decline. (Keep reading for my latest updates to that forecast.)
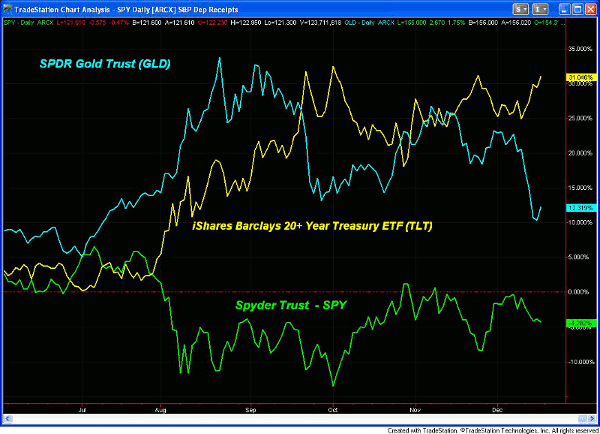
Of course, the big surprise for 2011 was the performance of the Treasury market. This chart compares the performance of the iShares Barclay 20+ Treasury ETF (TLT) with that of the SPDR Gold Trust (GLD) and the Spyder Trust (SPY) since the start of 2011.
It shows that TLT is up 33.7%, with GLD now only up 15% (it was up over 37% in August), and SPY currently down for the year. Furthermore, the recent analysis of the Treasury market suggests that bonds could be ready to stage another rally. This move to lower yields has potentially negative implications for stocks.
As I noted earlier, better-than-expected jobless claims Thursday (hitting a three-and-a-half-year low) was just one of the positive economic numbers last week. Empire State Manufacturing was much better than expected, as was the Philadelphia Fed report. However, industrial production numbers were weaker.
The focus this week is on housing, with the Housing Market Index on Monday, followed by housing starts Tuesday and existing home sales Wednesday. On Thursday, we get the final reading on GDP for the third quarter, as well as jobless claims.
The busy economic week draws to a close Friday, as we have durable goods, personal income, and outlays, as well as new home sales, before the three-day holiday weekend. (All markets are closed on December 26.)
NEXT: What to Watch
|pagebreak|WHAT TO WATCH
Last week’s action was certainly disappointing, as was Friday’s mixed close, as early strength dissipated by the close. The market internals were positive Friday, but the overall action did not give us any strong signals for Monday’s session.
The sentiment has actually gotten a bit more bullish over the past few weeks, which I found quite surprising. The number of bullish newsletter writers is up to 45.3%, and has improved from the early October reading of 34.4%.
Individual investors as measured by the AAII survey are also more bullish as of December 15, with more than 40% bullish. This is certainly in contrast to my analysis, since I became more cautious as the week progressed.
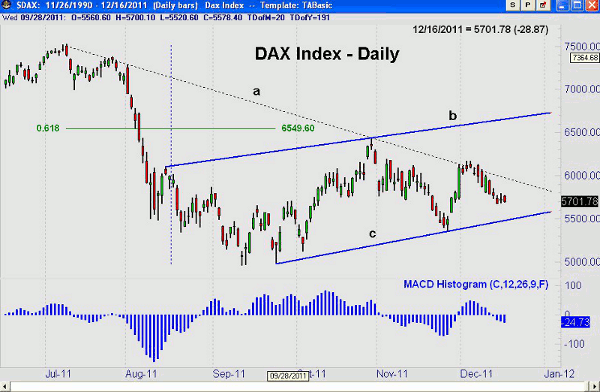
One market index that I will be watching closely is the German Dax. The pattern since the August lows (lines b and c) is looking more like a continuation pattern. These are interruptions or pauses in an upward or downward trend, and on a move below 5,360, the Dax is likely to test, if not breach, last summer’s lows.
The daily MACD-Histogram has dropped below the 0 line, which indicates the short-term momentum is negative. It would take a move back above 6,170 to reverse the deterioration. The October rally failed to overcome the major 61.8% retracement resistance at 6,549 and decisively overcome the downtrend (line a).
- To learn more about continuation patterns, see “No Need to Pick Bottoms or Tops."
S&P 500
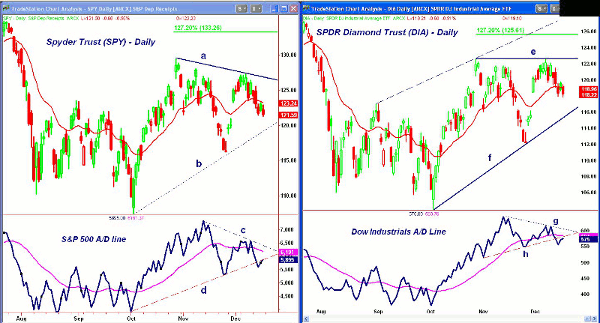
The Spyder Trust (SPY) traded below its declining 20-day EMA for the last three days last week, and has now filled the gap from the November 30 rally. The uptrend (line b) is now at $119.65, with the prior swing low at $116.20.
This week’s trading lesson, “One Indicator Stock Traders Must Follow,” was written to train stock investors how to use the A/D line. This will come in handy, as the S&P 500 A/D line is approaching a critical juncture.
The uptrend in the A/D line (line d) was broken last Wednesday, but it has since turned up. The A/D line needs to move back above its WMA and the downtrend (line c) to signal higher stock prices. Conversely, a drop below last week’s lows and the late November lows would clearly be negative.
The SPY has minor resistance now at $123.20 and then $125.40, with major levels around $127.56. A close above this level will signal a test of the October highs of $129.42.
Dow Industrials
The Spyder Diamonds Trust (DIA) is still acting better than the SPY, but is also below its flat 20-day EMA (in red). There is still support from the recent gap between $116.18 and $118.41.
On December 7, DIA came within a few cents of the October highs, and the failure to break out is now looking a bit more negative. If these highs are decisively overcome, the 127.2% Fibonacci retracement resistance stands at $125.61.
The daily Dow Industrials A/D line also violated its uptrend (line h) last week, and is still below its flat WMA.
A strong move above its previous peak and the downtrend (line g) is needed to turn the momentum positive. A close in the A/D line below the late November lows would create a short-term downtrend.
There is initial resistance now at $120, and a close above $121.50 would be a positive sign. On an upside breakout, the first target is $125.61.
NEXT: Nasdaq, Small Caps, and Tom's Outlook
|pagebreak|Nasdaq-100
The PowerShares QQQ Trust (QQQ) held up pretty well last week in light of both the increasingly negative outlook as well as the announcement that Intel (INTC) would miss its forecast due to supply problems caused by the floods in Thailand. INTC was down over 6% for the week.
There is initial support at $54.60 (last Thursday’s low), with trend line support at $53.80. A drop below the November lows at $52.87 is likely to trigger much heavier selling.
There is a band of resistance now between $56.40 and $57.62 which needs to be overcome to improve the outlook. The daily A/D line is still holding above its uptrend and the late November lows.
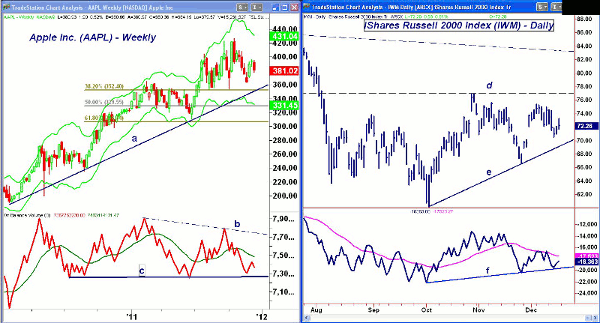
Of course, one of the problems for the tech sector has been the weak action of some of its leaders. Take Apple (AAPL). Apple's recent rally failed below the resistance at $400, and this week it formed a low close doji (LCD) formation.
For those who are followers of candlestick charts, the LCD is a negative formation first described by John Person. It is discussed in his book Candlestick and Pivot Point Trading Triggers.
The 38.2% Fibonacci support and the weekly uptrend (line a) are in the $352 area, with the 50% support and the weekly Starc- band at $329 to $331.
The weekly on-balance volume (OBV) failed to confirm the recent highs, as indicated by the downtrend (line b). It is below its WMA, and a break of support (line c) would be more negative.
Russell 2000
The iShares Russell 2000 Index Fund (IWM) has also filled its gap from last month, and was a bit stronger on Friday, but closed well below the highs. IWM still needs a couple of consecutive strong closes to turn the relative performance, or RS analysis, positive.
There is still key resistance at $74.40 to $75.39, which was the early December high. A close above this level will signal a challenge to the major 61.8% resistance in the $77 area (line d).
The daily A/D line failed to move above its declining WMA on the recent rally, which is not an encouraging sign, and it is not far above the important support at line f. Of course, a drop below the October lows would be even more negative.
There is initial support at $70.58, with the uptrend (line e) now at $69. The November 25 lows follow at $66.62.
NEXT: Sector Focus, Commodities, and Tom's Outlook
|pagebreak|Sector Focus
The iShares Dow Jones Transportation ETF (IYT) is still leading the S&P, as it held up better than the S&P 500 last week, and was one of the strongest sectors on Friday.
A strong close above $89 would be a short-term positive, with major resistance next at $90.74. If this is overcome, it should signal a move to the summer’s highs of $98.63 to $101.60.
Several of the sectors that were strongest from the October lows, like the Select Sector SPDR Energy (XLE) and the Sector SPDR Industrials (XLI) were under pressure last week. It will now take a few weeks of higher prices to suggest that they have formed a significant low.
If the major averages break the support levels outlined earlier, then defensive sectors like the Select Sector SPDR Utilities (XLU), Select Sector SPDR Consumer Staples (XLP),and Select Sector SPDR Health Care (XLV) should do the best.
On Friday, I discussed the improving action in the Select Sector SPDR Utilities (XLU) and the positive volume action of two individual utility stocks.
Oil
Crude oil was hit hard last week, as the February contract broke support in the $95 to $96 area. The 38.2% support from the October lows at $92.74 has been reached. The more important 50% retracement support is at $89.50.
Volume was fairly heavy on the decline, so some work will be needed before it can bottom out. Some of the oil drillers were hit especially hard.
Precious Metals
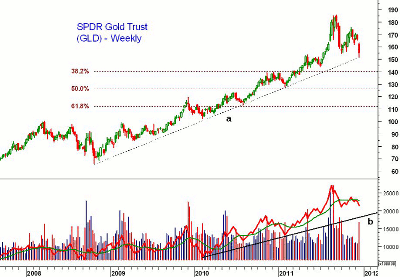
I covered the gold market and the SPDR Gold Trust (GLD) in detail last Tuesday, and this week’s drop looks like panic selling.
The weekly uptrend that goes back to the 2008 lows (line a) has been reached, with the minor 61.8% Fibonacci retracement support from the early-2011 lows at $150. There is further support in the $145 area.
The recent drop has likely pushed bearish sentiment to extremes. This should set up a buying opportunity by the middle of January, but I would wait for new buy signals.
The more important major 38.2% support from the 2008 lows is just above $140. The first strong resistance stands in the $158-$160 area.
The iShares Silver Trust (SLV) cracked the support in the $29 area. It continues to look weak.
The Week Ahead
As I noted last week, the stock market needed a strong performance to suggest it was ready to break out to the upside. This is still possible, but it will be important that the market internals (like the A/D lines) do not break key support.
Since breaking support is now a greater possibility, I would recommend moving up stops on existing long positions, or at least reducing your exposure, as the risk on the long side has increased. A drop below the November 25 lows may trigger heavier selling.
Also keep an eye on the bond market. If yields continue to drop, it would be a further warning sign.
As for gold, the longer-term analysis is still positive, but stops should depend on your entry level.
This is the last Week Ahead column for 2011. I will be taking some time off, but keep checking Charts in Play over the next few weeks, as I will keep updating the market outlook there from time to time.
Here's wishing you all a joyous and happy holiday season.
- Don’t miss Tom’s latest Trading Lesson: One Indicator Stock Traders Must Follow

