It's hard not to be frustrated by the unceasing volatility in the markets, but certain sectors should still be excellent buys on any pullbacks heading into year-end, writes MoneyShow.com senior editor Tom Aspray.
After the prior week’s 7.3% gain in the S&P 500, last week was bound to be a disappointment. Nevertheless, the relatively flat performance last week was pretty good, and certainly better than I expected.
Last week’s trading kept up with the recent level of volatility. The week’s early rally was met with heavy selling on Thursday, as the positive impact of the widely expected ECB rate cut was dampened by comments which sent the yields on the Italian bonds sharply higher. The short-term technical action as of Tuesday’s close warned of a correction.
The market got relief early Friday, as 17 countries agreed to an intergovernmental arrangement to handle budgetary matters, but the UK dissented. Since it was not unanimous, it will not be reflected by changes in any existing EU treaties. This, of course, puts the focus back on the ECB, which will need to take more forceful action.
The bottom line is that we are likely to see more sharp jolts to the stock market between now and year-end. The technical action favors higher prices going into the end of the year as long as the November 25 lows hold.
A gain of another 4% to 6% in the major averages would catch many by surprise, because after every successive market drop, we hear more analysts claim that we are already in a new recession or will enter one soon.
On the back of the surprisingly good monthly jobs numbers on December 2, last Friday’s preliminary reading on consumer sentiment from Reuters/University of Michigan rose to its highest level since June. This is likely a plus for the retail sector.
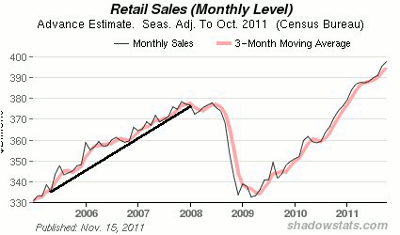
On Tuesday, we get the latest reading on retail sales which should be helped by the record Black Friday numbers. As the chart indicates, retail sales have exceeded the 2008 peak, and are in a solid uptrend.
The prior uptrend was broken in early 2008, when retail sales topped out by the middle of the year (keep in mind, the economy was then solidly in a recession). Though this is just one economic indicator, in the past these charts have often given us some good insight.
Also on Tuesday, we get the report on business inventories, followed by import and export prices on Wednesday. The economic calendar gets busier on Thursday with jobless claims, producer prices, industrial production and the Philadelphia Fed Survey. Finally, on Friday, we get the Consumer Price Index.
Friday is additionally triple witching—the end-of-the-quarter event when the stock-index futures, stock-index options, and stock options for December all expire. As the name indicates, these days are often accompanied by increased volatility and heavy volume.
NEXT: What to Watch
|pagebreak|WHAT TO WATCH
I was looking for a pullback early last week, and the sluggish nature of the rally suggested that by the middle of the week a deeper correction was possible. Friday’s strong performance clearly improved the technical outlook, but the market needs several strong days early this week to indicate prices are ready to accelerate higher.
The sentiment of both newsletter writers and individual investors fluctuates from week to week, but the majority are bullish. The readings are still well below the extreme levels that are typically seen at significant market tops. As you will recall, the sentiment was extremely bearish at the October lows.
(For more on the AAII Sentiment survey, watch “Secrets of the Sentiment Survey.")
S&P 500
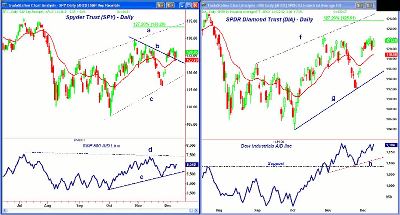
The Spyder Trust (SPY) tested the rising 20-day EMA Thursday at $123.65 and its breakout level (line b) before closing sharply higher Friday.
This low now represents first support, with further levels between $121.35 and $122.50. The daily uptrend (line c) is now at $118.35, with key support at $116.20 and the November 25 lows.
The S&P 500 A/D line turned up Friday, but is still well below major resistance (line d). Important support for the A/D line is at line e and the most recent lows.
A close above $127.50 will signal a test of the October highs of $129.42. The 127.2% Fibonacci retracement target is at $133.26, with the upper trend line resistance (line a) now at $134.
Dow Industrials
The Spyder Diamonds Trust (DIA) held up much better than SPY on last Thursday’s drop, as it held well above the rising 20-day EMA (in red).
It tested the October highs last Wednesday, and a decisive close above $122.58 should signal upward acceleration. The 127.2% retracement resistance stands at $125.61, with the upper channel (line f) at $127.
The daily Dow Industrials A/D line is also quite close to its prior highs, and shows a short-term as well as a longer-term pattern of higher lows. Initial support for the A/D line can be found at line h, with further levels at the late November lows.
The daily relative performance, or RS analysis (not shown) broke out to the upside last week. Near-term support for DIA sits at $119.64, followed by the gap between $116.18 and $118.41.
Nasdaq-100
The PowerShares QQQ Trust (QQQ) and the high-tech sector continues to be out of favor, as it has failed to outperform since the October lows.
Though it closed higher last week, it is still well below the strong resistance in the $57.50 to $58.50 area. QQQ traded as high as $59.83 in July.
The daily A/D line has turned up and continues to lag, while the daily on-balance volume (OBV) is still below its WMA. Therefore, it would take several weeks before this sector could take a leadership role.
There is still initial support at $54.60 (last Thursday’s low), with more important levels at $53 to $53.50. A close below $53.80 would be negative.
NEXT: Small Caps, Sector Focus, and Tom's Outlook
|pagebreak|Russell 2000
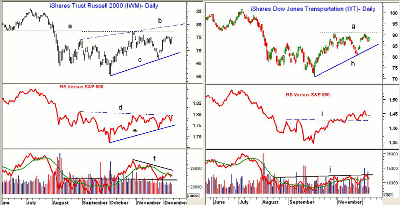
The iShares Russell 2000 Index Fund (IWM) rallied sharply Friday, closing below the recent highs at $75.39.
A close above this level is likely to mean that IWM will finally overcome the major 61.8% resistance in the $77 area (line a). This would signal a move to the trend line resistance at $80, if not the longer-term resistance in the $84 area.
The daily RS line turned up Friday, and could move through resistance (line d) early this week. This would signal that the small caps are now starting to lead the S&P 500 which is consistent with the January Effect.
The daily OBV was much stronger than prices in October, and is now trying to move back above its WMA. It will take a strong close above the downtrend (line f) to turn bullish.
There is initial support now at $72.22, with the uptrend (line c) now at $68.60.
Sector Focus
The transportation stocks are an important market sector, so I closely monitor the iShares Dow Jones Transportation ETF (IYT). It started to outperform the S&P 500 in the middle of November, when the RS line moved through its resistance (line i).
IYT has key resistance now at $90.74 (line g), which if overcome should signal a move to the summer’s highs of $98.63 to $101.60.
Volume was heavy on last Thursday’s drop, which has kept the daily OBV below resistance (line j). To confirm the price breakout, one would like to see high volume.
There is initial support at $86.60, with stronger levels now at $84.40.
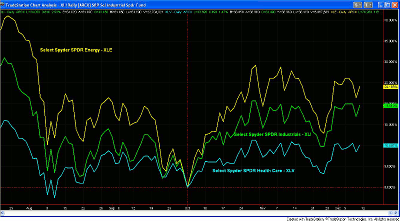
Despite the sharp drop in the middle of November, the Select Sector SPDR Energy (XLE) has been one of the hottest sectors, up over 24%. The Sector SPDR Industrials (XLI) have also done well, rising 19.8%.
Both have done much better than the less volatile and lower-risk Select Sector SPDR Consumer Staples (XLP) and the Select Sector SPDR Health Care (XLV), which are both up just over 10%.
As I discussed last week, the long-term RS analysis for Select Sector SPDR Health Care (XLV) has deteriorated recently. On the other hand, it will take a few more weeks of positive action for the weekly analysis of the energy and industrial sectors to turn positive.
NEXT: Bonds, Commodities, and Tom's Outlook
|pagebreak|Interest Rates
I have been watching the bond market closely over the past few months. Although it is possible that they did make a significant top in the summer, concurrent with the peak in bullish sentiment, the bond ETFs I covered on Friday need to be monitored closely.
Oil
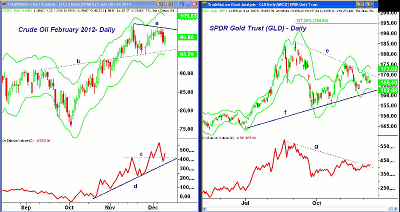
Crude oil corrected briefly last week, but the February contract held well above support in the $95 to $96 area (line b). The daily flag formation has key resistance now at $102.50, which if overcome should signal a move to the $106 to $107 area.
The upper daily Starc band is now just above $105.58, with the weekly above $110.
The daily OBV continues to act stronger than prices, already having moved well above the November highs (line c). The OBV has good support at line d.
Precious Metals
The SPDR Gold Trust (GLD) dropped briefly below the $166 level last week, where it was well supported. There is further support in the $162 to $163 area and the daily Starc- band.
A close above the recent high of $170.80 would convincingly break the downtrend (line e), with the next target just above $173 and the daily Starc+ band. There is further resistance at $177 to $180, while the daily flag formation (lines e and f) has Fibonacci retracement targets of $194.69.
The daily OBV has just slightly broken its downtrend (line g), suggesting that the worst of the selling may already be over. The seasonal tendency is for gold to bottom later in the month and then rise into February.
If gold’s correction is over, silver is also likely to be strong—as long as the iShares Silver Trust (SLV) can hold support in the $29 area. A close above resistance at $34.50 should signal a move to the 50% retracement resistance of $37.60.
The Week Ahead
Every downdraft in the stock market convinces those who were waiting to “buy on the dip” to change their minds, only to be left on the sidelines.
Much of the price action often comes overnight in the futures, causing either sharply higher or sharply lower openings. This is likely further frustrating the investing public.
To signal sharply higher prices in the major averages, we need to see a move above the recent highs and watch the Dow Industrials, or the SPDR Diamonds Trust (DIA) in particular, as it should break out first.
This would cause a strong rally into Christmas, but would not be the oft-mentioned Santa Claus rally. The latter refers to the market's tendency to rise for the last five days of the year and the first two of the following year.
If the small caps start to outperform the S&P 500, that would be my favorite area, but continue to move up stops and take some profits on the days when the market is up sharply.
- Don’t miss Tom’s latest Trading Lesson: The Four Key Seasonal Trends for 2012

