As the markets continue to defy the bears, a proper breakout could be on its way as early as next week. So watch for any pullback as a buying opportunity in these specific sectors recommended by MoneyShow.com senior editor Tom Aspray.
Stocks were choppy again last week, as Euro debt concerns once again pulled the rug out from under the market early Wednesday. Though the damage to the major averages was pretty severe—pretty much all stocks were down—individual issues and most of the key ETFs held at first support.
The higher weekly close indicates that the bulls are still in charge, and the market leading behavior of the A/D lines (see below) that track the market’s internal health suggest prices could melt up next week. Many of the charts show bull flag formations, which if completed project a move well above the October 27 highs.
Every sharp drop further convinces the bears that this is a “bull trap” that will be followed by a drop to the October or even the August lows. Certainly, if the drop last week had violated support for the Spyder Trust (SPY), it would have favored a deeper correction within the uptrend…but these levels held.
While many professional investors and money managers are still in the bearish camp—and woefully underinvested—the AAII sentiment numbers shows that the number of bulls rose to 44.7%, quite a ways above the 25.3% reading seen in late September when the gloom and doom was thick. The number of bulls could easily rise to the 55% to 60% level by the end of the year, once the S&P closes convincingly above 1,300.
As I have been saying for several weeks, if we see a shift from bonds to stocks the rally could get exciting. I feel that by Christmas, many will regret not being more fully invested.
That does not mean we won’t see further shocks in the market along the way, even though the change of leadership in Greece and Italy (expected last week) has temporarily calmed the markets.
The markets are closely focused on the bond yields of the weak Eurozone countries—when the yield on Italian bonds spiked above 7%, it rattled the markets, although several countries have higher yields.
Anyway, most of the yields came down by the end of the week, with Italy down to 6.6%, Greece at 29%, Portugal at 12.5% and Ireland yielding 8%. Of course, these yields are all viewed relative to the German bund, currently yielding 1.85%.
The market sentiment of where these yields may be headed is equally important, as the focus Friday was on French bonds after their yields hit a four-month high.
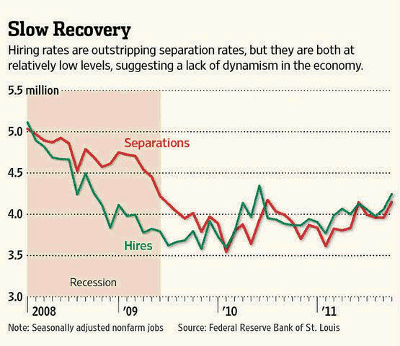
This chart from The Wall Street Journal suggests the labor market is improving. If this were a stock chart, I would be buying this base formation.
Most of the US economic news last week was encouraging, especially the preliminary reading on the November consumer sentiment index from Reuters/University of Michigan. It came in at 64.9, up from 60.9 in October—much better than most expected. The decline in jobless claims was also a plus.
This week, we have a full slate of economic reports, starting on Wednesday with the Producer Price Index, retail sales, the Empire State Manufacturing Survey and Business Inventories.
We get the latest reading on the Consumer Price Index on Thursday, along with industrial production and the Housing Market Index. Because of the Veterans Day holiday, the jobless claims are out Friday, along with housing starts.
NEXT: What to Watch
|pagebreak|WHAT TO WATCH
Once the major ETFs make new highs for the month, it will signal the next major push to the upside. This will complete the continuation patterns, or flag formations, and allow the calculation of further upside targets.
Once the October highs are reached or exceeded, some selling is expected before they are convincingly surpassed. The volume and A/D line analysis are still showing uptrends for the major averages, and would need to show much more deterioration before a top is complete.
For now, the support at last week’s lows is the first level to watch. The November 1 lows represent the next, more important level of support.
S&P 500
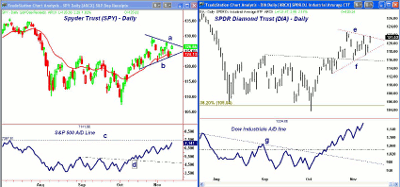
The Spyder Trust (SPY) dropped down to test daily trend line support (line b) on Wednesday in the $122.78 area before turning higher at the end of the week (line c).
The close on Friday was just below the upper boundary of the flag formation (line a). A close above $128.15 will complete the formation with initial targets at $131.50. There are additional upside targets in the $136 area.
The S&P 500 A/D line has turned up sharply, and is not far below the July highs (line c), when SPY was trading in the $134-$135 area. It would now take a drop below the early November lows to weaken it.
If last week’s lows at $122.86 were broken, the next level to watch is the 38.2% Fibonacci retracement support at $121.02.
Dow Industrials
The Spyder Diamonds Trust (DIA) closed right at the upper boundary of its flag formation (line e). Therefore, we could see a convincing breakout as early as Monday.
Once above the late October highs at $122.58, the longer-term downtrend is at $123.56. The initial Fibonacci projections from the flag formation are at $124.36 and then in the $128 area.
The Dow Industrials A/D line continues to act the strongest, as it is in a very steep uptrend. It has been leading the other major A/D lines since it broke through its downtrend.
There is now minor support for DIA at $119.50, and then at last week’s low of $117.48. The 38.2% retracement support level is at $115.48.
NEXT: Nasdaq, Sector Focus, and Tom’s Outlook
|pagebreak|Nasdaq-100
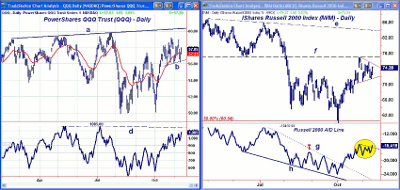
The PowerShares QQQ Trust (QQQ) has been underperforming the SPY and DIA for the past few weeks. The weekly RS analysis has not topped out yet, so I have not given up on the technology sector, because their earnings are generally stronger.
The low last Wednesday was $56.23, just slightly above the prior lows at $56.12 and $55.79. A convincing close above $58.98 will signal a rally to the trend line resistance in the $60.50 to $61 area.
The Nasdaq-100 A/D line improved last week, as it has turned up more sharply. The A/D line is not far below the year’s highs, (line d).
In the past, the bears have been selling QQQ every time it gets up to $59 or $60, so a move above this level could cause quite a squeeze.
Russell 2000
The iShares Russell 2000 Index Fund (IWM) also held above the early November lows at $70.96 last week. It now has short-term support at $71.63.
The daily chart also shows a short-term flag formation (in red), which if completed will signal a sharp move above the 61.8% retracement resistance level just above $77.
The first upside targets are at $78.62, with stronger weekly resistance in the $80 to $82 area.
The RS analysis is still trying to bottom out, and this is the month to start looking at the small-cap stocks, which typically outperform the S&P 500 as we enter the new year. (This is the so-called "January effect," but in the past few years it has sometimes started earlier.)
The Russell 2000 A/D has already broken out of its flag formation, which is a positive sign.
Sector Focus
The Dow Jones Transportation Average has traded in a very tight range over the past two weeks, with support at 4,700 and resistance at 5,067. The close on Friday was just below the prior swing high at 4,978, so watch for a move above 5,000 for advance warning of an upside breakout.
As I noted earlier this week, the financial sector—especially the big US and overseas banks—should still be avoided. Sticking with those sectors that have positive weekly relative performance, or RS analysis, should give you a better chance to be in the right sectors at the right time
In addition to the Select Sector SPDR Consumer Durables (XLP), the Select Sector SPDR Energy (XLE), and the Select Sector SPDR Industrials (XLI), the Select Sector SPDR Technology (XLK) and the Select Sector SPDR Utilities (XLU) are in this group.
NEXT: Sector Analysis, Commodities, and Tom’s Outlook
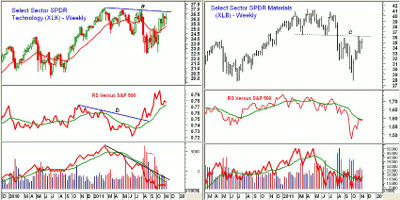
|pagebreak|The weekly chart of the Select Sector SPDR Technology (XLK) looks very positive based on the RS analysis, though the on-balance volume (OBV) is still lagging. The RS line is in a solid uptrend after breaking its downtrend (line b) during the summer.
The weekly OBV is still below its WMA, but the daily OBV is positive. Other measures of the tech sector do show better OBV. If XLK can move above $26.72 (line a), it would be very bullish.
On the other hand, the Select Sector SPDR Materials (XLB) continues to look weak, as it has just reached strong resistance in the $36 area (line c).
More importantly, the RS line has just rallied up to its declining WMA, and the WMA is still declining sharply. The OBV is trying to bottom out, but we are waiting for its WMA to turn higher.
Oil
After completing its double-bottom formation, crude oil has continued to move sharply higher. I discussed this market in more detail earlier today.
Precious Metals
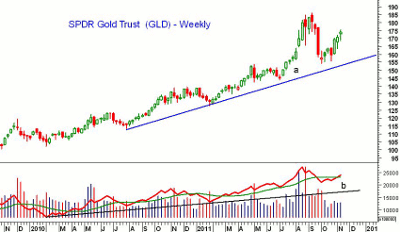
The SPDR Gold Trust (GLD) closed sharply higher this week, and above the 61.8% resistance at $173.76. This suggests that the correction is over.
I had been looking for another decline—possibly as low as $1,500—to complete the correction, but this now looks less likely, since GLD has held well above the weekly uptrend (line a).
The weekly OBV has moved back above its WMA, but the WMA is still flat. There’s lots of volatility here, and investors should be watching closely during the next $30 drop in the gold futures.
The next resistance stands in the $176 to $178 area, with support at last week’s lows of $168.83.
The Week Ahead
I think that despite the slate of economic news, this week will end up being a strong one for the stock market, and that the overall view of the economy will also improve.
After the flag formations are completed, we could get a retest of the breakout level, which would be a good buying opportunity. If you are long, move your stops up once the October highs are exceeded.
If instead, we crash to the downside and close below last week’s lows, it will invalidate my short-term outlook and favor a further decline. If this occurs, it will not change the positive intermediate-term trend.
There are still some stocks that are completing their bottom formations. I recommended two oil stocks today that are close to completing reverse head-and-shoulders bottom formations.
Don’t miss Tom’s latest Trading Lesson: A Chart Formation the Pros Love

