Hurricane Irene looks tough enough, but the barrage of economic news next week could be even more of a problem for the market, given the trend of recent reports. The ability of the market to hold above the early August lows will improve the outlook as we head into September, writes MoneyShow.com senior editor Tom Aspray.
The equity markets were again buffeted by cross-currents last week, but did manage to close higher overall. Even though there was plenty of volatility, the ranges have actually narrowed since the crazy days in early August.
The markets' strength early in the week was in spite of more Eurozone concerns, as spreads widened on the Spanish and Italian credit-default swaps, and Greek bonds hit a new high in yield.
Even the US financial sector was under pressure, as rumors swirled about Bank of America (BAC). Even though it hit a low of $6.01 on Tuesday, the S&P 500 managed a 3.3% gain for the day.
The short-term technical picture improved further Wednesday, suggesting the S&P 500 could again move to the upper boundaries of its trading range. The rally was quashed Thursday in spite of Warren Buffett's $5 billion vote of confidence in Bank of America.
The economic news generally did not help; Wednesday's durable-goods report was one of the few bright spots for the US economy. The preliminary reading of the GDP on Friday showed a meager 1% gain.
There was some slightly better news from China, as their manufacturing data suggested that their economy might have bottomed this month.
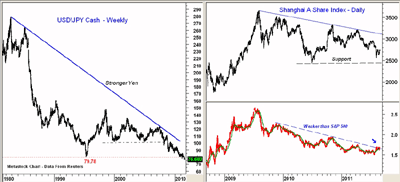
The Chinese market had its best day in two months, and the chart of the Shanghai A Share Index is starting to look more interesting. Its drop in early August held well above the 2010 lows.
Furthermore, the downtrend in the RS analysis that has been in effect since late 2009 is now being tested. Therefore, instead of being weaker than the S&P 500 (which it has been since 2009), it may start to outperform the index.
There was also quite a bit of interest in Japan, as the country's sixth Prime Minister in five years resigned Friday, and the yen moved to another multi-year high.
The chart above shows that in 1980, the rate was 270 yen per dollar. That's ancient history; the current rate is 76 yen per dollar. This is going to make a recovery in Japan even more difficult.
This week is a major one for economic reports-and given the previous signs of a deteriorating economy, it could make it difficult for the stock market.
The week starts off with a bang on Monday as we have the personal income and savings numbers, pending home sales, and the Dallas Fed Manufacturing Survey. It was the more important Philly Fed survey that hammered the market a few weeks ago.
Tuesday brings the Case-Shiller Home Price Index and consumer confidence
numbers, followed by the ADP Employment Report and factory orders on
Wednesday.
More news on the health of the manufacturing sector
comes Thursday with the ISM Manufacturing Index, and then we end the week with
the monthly employment report.
If stocks can hold above the August lows after all of these reports, it will give the bulls some optimism.
NEXT: What to Watch
|pagebreak|WHAT TO WATCH
The strong rally early on Thursday, followed by the very weak close, suggests that the stock market's period of consolidation might be over.
The main concern was the formation of what is commonly referred to as "bear flags" in many of the US and the overseas markets. There are some good examples in Friday's article. These formations represent interruptions in the downtrend that take the form of a flag.
Stocks were hit hard early Friday, as the market was disappointed over Bernanke's comments. This made the rebound from the lows and the higher close a pleasant surprise, although it could be reversed easily with a couple of sharp down days. It is too early to look for a sustainable bottom.
S&P 500
The Spyder Trust (SPY) dropped below the prior two days' lows at $115.87, before turning higher and closing strong.
A move above last Thursday's high of $119.40 will increase the odds of a rally to stronger chart and retracement resistance at $120.50 to $121.20. Much stronger resistance follows at $122.50 to $123.70.
The short-term support is now in the $113.40 to $112.41 area, which if broken will suggest a drop below the August lows. The target from the flag formation and the major 50% support levels are at $101 to $102.14.
Dow Industrials
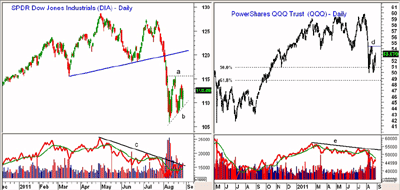
The Spyder Diamonds Trust (DIA) continued to act better than the SPY, as it is not burdened by the financial stocks. If DIA can overcome the resistance at $113.78, it could test the $115.60 area (line a).
The short-term trend line support in the $109 area (line b) was tested last Friday. A close below it will suggest a drop to the 38.2% retracement support at $105.46.
The daily on-balance-volume (OBV) has moved back above its WMA, and is testing its downtrend.
Nasdaq-100
The PowerShares QQQ Trust (QQQ) came under pressure with the surprise resignation of Steve Jobs from Apple (AAPL)...but it recovered nicely on Friday, overcoming Thursday's high and closing near the week's best level.
QQQ is the strongest of the US indices right now, as it has held above the minor 61.8% support level from the 2010 lows, which stands at $48.48. The August low was $49.93.
The daily chart shows a potential bottoming formation, now that the gap in the $52.14 to $53.02 area has been filled. A move above $54.40 (line d) would signal a rally to the $55.50 to $56.50 area, where stronger resistance awaits.
The daily OBV is still negative, as it is below both its WMA and its downtrend (line e).
Russell 2000
The iShares Russell 2000 Index Fund (IWM) also shows a bear-flag formation with key support at $64.57. The violation of the major 38.2% support level favors an eventual drop to the 50% support in the $60.54 area.
The downside target from the flag formation (lines d and e) is in the $56 area.
There is first resistance now in the $70.30 to $71.89 area with more important levels at $73.50.
NEXT: Sector Focus, Oil, Bonds, and Tom's Outlook
|pagebreak|Sector Focus
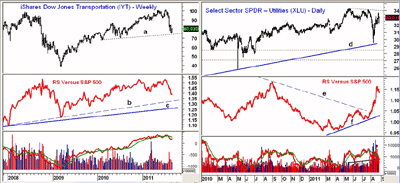
The iShares Dow Jones Transportation Average ETF (IYT) led the market on the downside, and has already dropped below the August lows. This may be a sign that it will bottom ahead of the major averages.
The weekly RS analysis shows that it is still above both the intermediate uptrend (line b) and long-term uptrend (line c). This indicates it is still stronger than the S&P 500.
The weekly OBV is below its WMA, but does not look too bad considering the sharp decline over the past month. There is first resistance for IYT at $84.39, and then in the $88 to $90 area.
Another sector that continues to act very well is the Select Sector SPDR Utilities (XLU). It dropped sharply on the panic selling in early August, but held the long term uptrend (line d).
XLU has also rebounded very sharply, and is already approaching the July highs in the $34 area.
The RS analysis completed its bottom formation in May, and has recently overcome the long-term downtrend (line e). It shows a solid uptrend (line f).
This is a sector I continue to like, and would look to buy on any decent setback. (You can read about some of my favorite global utility stocks here.)
Oil
October crude oil closed the week almost $2.50 higher, and has a chart pattern similar to several of the stock-market averages. If it can move above the $87 level, it could test stronger resistance in the $90 to 92 area.
There is initial support at $81.18, and if the $79.38 level is broken, a test of the lows in the $76 area seems likely.
Interest Rates
The yield on the ten-year Treasury stabilized, as for the first time in four weeks, yields did not make a new low. Bonds had a sharp selloff during the week and closed lower.
NEXT: Precious Metals and Tom's Outlook
Precious Metals
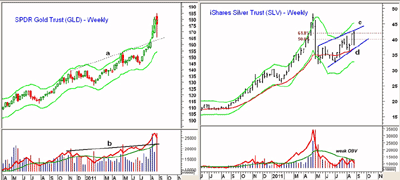
Gold prices were hit hard in the
middle of the week, but then rebounded sharply, and the SPDR Gold Trust was down
just $3.80 for the week. At one point, it was down almost $14.
The starc band analysis warned of such a decline, and GLD is still in a higher-risk buy area, as the weekly close was again near the upper starc bands.
The increase in margin rates last week may not be the last ones, and if we challenge the recent highs another hike is possible. Though last week's drop helped to lessen the excesses, I still think this market is vulnerable to a sharper decline.
The iShares Silver Trust (SLV) surged above the major 61.8% resistance last week, but closed below it. The rebound from the May lows still looks like a continuation pattern or a pause in the downtrend.
A weekly close above $43 would be positive, while it would take a close below $36 to pressure the downside.
The Week Ahead
Despite the higher weekly close, the action was still choppy, as the bulls and bears continue their tug of war.
My main concern for this week is another Eurozone shock that coincides with a New York market that is closed because of Hurricane Irene. This could create the environment for another market downdraft that might complete the decline from the July highs. Too early to tell but buckling your seat belts might still be a good idea.
If, instead, we get a stronger rally over the next week or so, it will be the strength of the market internals that will tell us if it is sustainable. They would need some significant improvement.
- Don't miss Tom's latest Trading Lesson, "How to Get Started in Chart Reading."


