Jill Noble of ElliottWave.com writes about how to apply Fibonacci retracements to your trading.
Technical analysis offers many ways to identify a trade setup. Before entering a trade, a successful Elliottician knows that it is necessary to set a price target and a stop. Fibonacci retracements are a time-tested method to determine key support and resistance levels.
In the 13th century, Leonardo Fibonacci became the first Westerner to identify the numerical sequence at the heart of the Golden Ratio. Some 700 years later, R.N. Elliott saw the Fibonacci sequence at work in the Wave Principle, or the "key to market behavior" Frost and Prechter described in The Elliott Wave Principle in 1978.
For the Elliott wave analyst, the stock market is a
"record of the fluctuating self-evaluation of social man's own productive enterprise [which] makes manifest specific patterns of progress and regress… The briefest way to express this principle is a simple mathematical statement: the 1.618 ratio."
EWI senior tutorial instructor Wayne Gorman explains that Fibonacci patterns within a particular market will help you identify key reversals.
The lesson below—adapted from Wayne Gorman's How You Identify Turning Points Using Fibonacci—explains what you can expect when a market begins a corrective phase.
Retracements – Corrective Waves
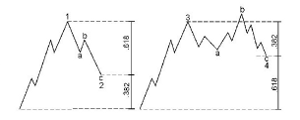
If we look on the left side of this chart, we see a diagram of wave 1 followed by wave 2. It is common for second waves to retrace .618 of wave 1—thereby making a deep retracement. We will also be looking for .786. We might often see .5, 50%, but .618 is common. On the right side, fourth waves will commonly retrace a smaller percentage or .382 of wave 3. We might also see something like .236.
NEXT PAGE: Examples to Reinforce the Concept |pagebreak|
Examples
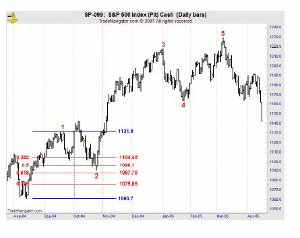
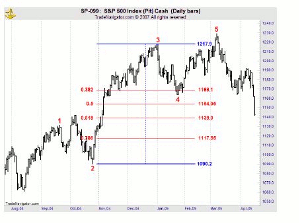
I have put the wave count on this chart of the S&P 500. We have waves 1, 2, 3, 4 and 5. Wave 2 is an expanded flat. Wave 4 is a zigzag. Let’s look at the retracements that waves 2 and 4 make.
We see that wave 2 makes a deep retracement. It comes close to .618. Look at this Fibonacci table that I put up; notice that I put .382, .5, .618, and .786. .618 is 1087.75, and the S&P low is 1090.19.
We see that wave 4 makes a shallow retracement of wave 3. It goes just beyond the .382 retracement. .382 is 1169.1, and wave 4 actually bottoms at 1163.75.
In a nutshell, this is what we mean when we say that Elliott waves often correct in terms of Fibonacci ratios.
Jill Noble can be found on ElliottWave.com.


