Stock traders who use the Average Directional Indicator (ADX) can easily discern the strength or weakness of a trend, writes Brandon Wendell, although like all indicator signals, it lags price itself.
I often receive e-mail inquiries about which technical indicators are the best. I have said this before and will repeat it: the truth is that all technical indicators are lagging indicators. As traders, we need to rely on price itself and only use the indicators to help support our decision to enter or exit trades.
Nothing can replace reading price and entering at supply or demand.
See related: It All Starts with Supply and Demand
That being said, in order to have a second opinion on the strength of a trend we may be in, we can use a momentum indicator such as the Average Directional Indicator (ADX), also called the Directional Momentum Indicator (DMI). The ADX shows the strength or weakness of the current trend and can offer signals when the trend is weakening as we approach supply or demand zones.
See related: The Pure Technician’s Indicator: ADX
The ADX is made up of three parts. First is the positive directional indicator, or +DI. This measures the strength of the bullish pressure in price. Second is the negative directional indicator, or –DI. As you would guess, this line measures bearish pressure in the price movement. The ADX is a summary of these two opposing forces and measures the strength of the overall trend.
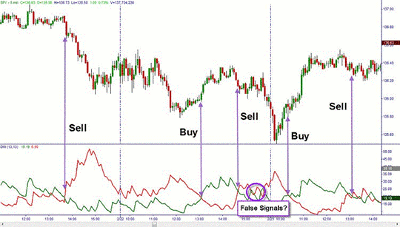
A simple buy signal with the ADX would be the +DI crossing above the –DI, while a sell would be indicated when the -DI crosses above the positive. There is one major problem with waiting for this particular signal: it is always going to occur after price has moved away from supply or demand.
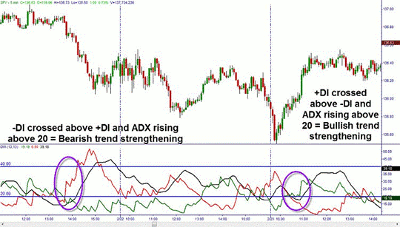
The ADX will rise when either a bullish or a bearish trend strengthens. When the ADX crosses above 20, whatever trend you are in is getting stronger. Look to see whether the +DI or –DI is moving up with the ADX at this point to see which trend we are in.
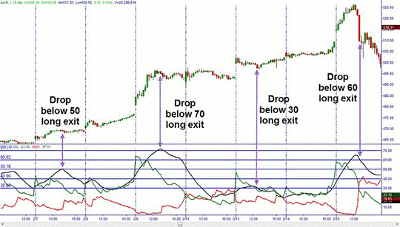
An additional signal to exit a trade can be when the ADX has crossed above a decade number higher than 20 and subsequently fell below that number. For instance, if the ADX happens to cross above 20, 30, 40, 50, 60, 70, 80, or 90, and then falls below that same level, the trend has weakened.
So, if you think the buy and sell signals seem to be lagging, you are right. The traditional buy and sell signals are always going to happen after price moves from the best entry or exit zones. However, there is still a use for the ADX indicator in our trading. We can look for warning signs of trend weakness before we turn at supply or demand zones. If we see these signals, it gives us more evidence of what action we should take at those zones.
See also: A Pro’s Favorite Safety-First Indicator
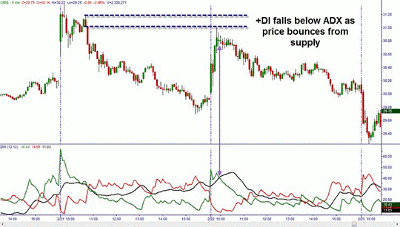
One weakness signal is when the +DI or the –DI crosses below the ADX when both were moving upwards. For a signal that supply may hold and end an uptrend, the +DI dropping below the ADX as you are approaching is a good signal.
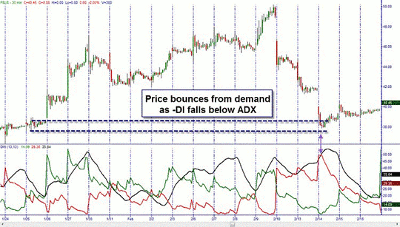
If price is approaching a demand zone and the –DI has dropped below the ADX line, then the demand has a better chance of holding and you may want to exit a short or initiate a long position.
Find out more about using momentum indicators here.
By Brandon Wendell, instructor, Online Trading Academy

