An expert technician assesses current Dow structure, reviewing the characteristics that should guide trading decisions in the current environment.
When you’re studying a price chart to assess trading opportunities, what is your eye drawn to first? Is it the indicators; moving averages; how about candles?
And when you are looking to put on a trade, are you taking a moment to address the context in which you’re placing that trade? Is it a counter-trend fade, a pro-trend retracement, a breakout from a consolidation pattern (like a rectangle or triangle)?
And when playing the breakout, are you looking to play a trend reversal breakout or a trend continuity breakout?
Mike Bellafiore of SMB Capital and frequent speaker at The Traders Expo often talks about the importance of market structure, and that inspired me to share a few tips on how to discern the current situation.
Let’s take a quick moment to review the foundational principle regarding trend structure that guides your answers to all the above questions.
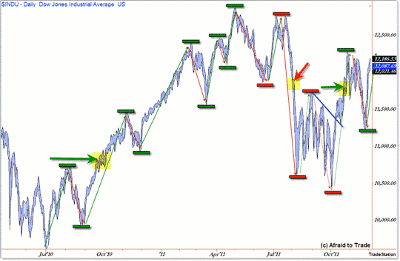
Here is the current “structure” chart of the Dow Jones over the last year:
Let’s step back to the most basic aspect of a price chart: price itself.
Stretching back to Dow Theory, an uptrend is defined as a series of higher swing highs and swing lows, while a downtrend is similarly defined as a series of lower swing highs and lower swing lows.
By extension, in an uptrend, the upswings tend to last longer in both duration (time) and price (percentage moves) when compared to down/retracement swings in an uptrend, and vice versa for a downtrend.
Translating that to trading opportunities, the best opportunities tend to occur in the direction of the prevailing trend (relative to your time frame).
However, not all trends last forever, and all trends will eventually reverse.
NEXT: 2 Telltale Signs of a Trend Reversal
|pagebreak|By definition, a trend reversal occurs when the following conditions are met:
- When reversing an uptrend, price must make a lower low, lower high, then swing back down to take out (trade under) the recent lower low
- When reversing a downtrend, price must make a higher high, higher low, then swing back to take out (trade above) the recent higher high
In other words, a structural trend reversal is a three-step price process. From this, we define not only market structure, but by proxy, trading opportunities.
In the chart above, the first trend reversal down occurred on August 2, 2011, when price broke and closed under the late-June swing lows, the first lower low.
Notice that price formed a lower high in July and then swung back to take out the prior swing low to create the official daily chart trend reversal signal.
After a continuation down move into October, price again reversed to the upside in mid-October after breaking above two mini-swing highs from July, forming a tight swing low on October 18 and then breaking the final mini-swing high at the 11,700 level.
Price is currently labeled as a structural uptrend with a key, “make or break” resistance challenge at the 12,200 recent swing high level where we are now.
These are larger-scale, structural reversals on the daily chart.
A major key to understanding market structure—a critical facet for trading—is the realization that higher-time-frame structure is built by lower-time-frame structure.
In other words, the recent upswing from 11,250 was built by—or comprised—its own trend reversal signal and series of progressive swing highs and lows.
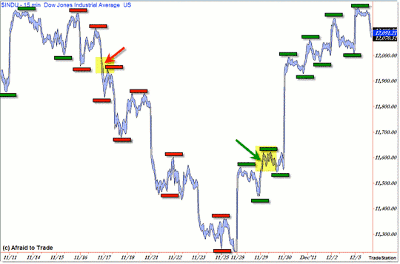
Let’s see that on the 15-minute intraday chart:
The 15-minute chart above shows us the November-to-present period, which consists of a structural (intraday) downtrend which reversed (ahead of the big end-of-November move, by the way) to an uptrend, as labeled.
When viewing this chart, put it in context of the daily chart above. What we’re seeing is a simple downswing that reversed into an upswing in the context of a brand new uptrend reversal.
Even after the trend reversal and the end-of-November rally, price has continued its intraday bullish structure with an additional progression of shorter-term swing highs and lows so far in December.
Continue to watch the current structure—particularly as it interacts with the key prior resistance swing high at 12,200—for any breakdown in the swing high/low structure above (namely, a move under the 12,000 area that results in a future lower swing high).
You can also see the educational example of how the intraday structure reversed from up to down on November 17 (notice the sequence of lower high, lower low, lower high, then a breakdown of the 11,950 lower low).
Price declined—in basic structure—towards the 11,250 low after triggering an official intraday reversal under 12,000.
Identifying or quantifying market structure is just the beginning. From there, you’ll look for confirmations/non-confirmations (including divergences) and other signals from your favorite indicators or methods to help you find low-risk, high-probability trades in the context of developing (or reversing) price structure.
On the other hand, if you’re not at least thinking about market structure, you could easily place yourself on the wrong side of a trending move and pay an unnecessary price for it.
By Corey Rosenbloom, CMT, trader and blogger, AfraidToTrade.com


