Keep close watch on the charts and these key market internals for clean warning signs about short-term price swings before they happen.
I’m a big fan of monitoring price swings using market internals, such as TICK, breadth, and volume difference, because these measures can give you early warning signs of a potential short-term swing in price.
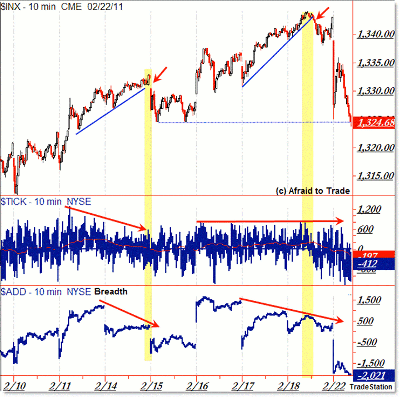
That was recently the case twice in the short-term time frame, so let’s turn the attention to our updated S&P 500 and market internals chart:
What we’re seeing above are my two favorite market internals, the classic NYSE TICK and NYSE breadth.
Let’s start on Valentine’s Day, February 14.
TICK peaked on Feb. 11 at the 1,200 level as price kicked off to a new and confirmed rally/breakout. Breadth pushed up to the plus-1,000 area and all was well as price rallied higher in the short term.
Then, we got the Valentine’s Day rally, but it was met with clear negative divergences in both TICK (successive highs) and breadth.
Tuesday gave us a trend line break and lower prices…but not for long!
Wednesday gave us a surge in both price and breadth; but not so much TICK.
Then price continued upwards until the holiday weekend, when a caution signal formed on the charts in the form of dual divergences and a price trend line break.
Can charts Friday predict that Libya’s protests would result in a down market today? No. Unexpected news is always a factor in trading, but in this case, the chart gave a clean caution, or warning signal to be defensive or flat ahead of the weekend.
How to Identify the Warning Signal on the Charts
Around midday on Friday, Feb. 18, price rallied to new recovery highs, but it did so on very weak breadth (around 500, as you can see) and a flat-lined TICK stuck around the 700 level. That is certainly not the picture of perfect bullish strength in the short term.
Divergences are one thing, but trend line breaks are another. Traders react to them either by stopping out or by putting on new positions, making breakthroughs of obvious trend lines something you should factor into your trading decisions.
As I post, we’re testing a horizontal trend line at the 1,325 level, so watch what happens there carefully. It would be bad for bulls if price shatters this level and continues lower.
Take time to learn how to use market internals as confirmation/non-confirmation signals as you set up your trades and game plan.
By Corey Rosenbloom, trader and blogger, AfraidToTrade.com.
Find several additional examples by searching for “market internals” on my blog.


