I love highlighting divergences in my articles. When price action doesn’t match an indicator like MACD, it is often a signal that price is about to reverse quickly. Divergences are also a great way to find profitable trades when you get used to seeing them at key turning points in the market, particularly at a higher time frame, key level.
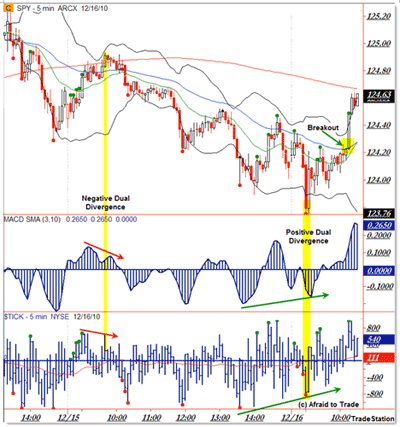
Let’s learn from a recent example from Friday morning’s hard push to new lows, which was met with a sharp positive TICK and momentum divergence. Note the powerful rally that erupted from the dual divergence at higher time frame support.
SPY Five-Minute Chart
What you are seeing above is my custom TradeStation display of the S&P 500 ETF SPY, and what I use as a proxy for the S&P 500 Index. Above is the 20- and 50-period exponential moving averages (EMAs) (green and blue) and the 200-period simple moving average (SMA) (hit as a short-term target).
Beyond that are the standard Bollinger bands and the custom 3/10 oscillator (MACD with SMAs instead of EMAs—periods 3 and 10). And of course the NYSE TICK.
OK, so here’s the main lesson. Markets often turn, and thus set up low-risk (tight stop), high-probability trades when intraday dual divergences form like in these two examples.
To locate divergences in real time, watch price highs relative to indicator and TICK highs. If price makes a new high but the indicators do not, then that is a divergence.
The first example was just before 10:00 am CST on December 15 with a quick move up to the higher Bollinger band as momentum and TICK failed to confirm the new price high just under $125.
Round numbers like $125 are often reference points that set up little intraday trades if divergences form into them…like this.
Article Continues on Page 2
|pagebreak|The trade entry/execution here was on the price break of the rising trend line, or more specifically, the price breakdown through the 20-period EMA at $124.70 (10:10 am). The stop goes above $125 and the minimum target is a retest of the prior low from the prior day’s closing level, which was hit a few hours later.
But I really wanted to call your attention to what happened this morning on the sharp bounce off $124.
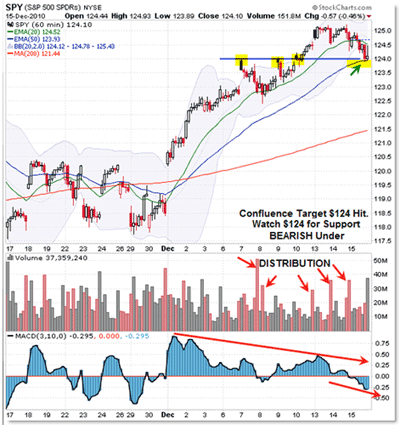
I indicated that $124 would likely be a key in a report to my members, as seen on this chart:
Without going into too much detail, the main idea for this example is that $124 was a potential confluence support level that could come into play during the next session (prior price highs and the 50-period EMA on hourly frame).
Of course, as we see above, it did, sparking a powerful rally.
Now glance back at the five-minute chart of today.
As price pushed to the $124 dual potential support target level, a clear positive TICK and momentum divergence formed with the final shove into this level at 9:00 am CST.
At a minimum—as is the case with initial divergences—this is a “take profits” signal if short, and an aggressive countertrade reversal (or scalp) long on a move off support. The stop goes under the $124 level.
The official breakout entry was on the power move above the declining trend line (not shown), or more importantly, the falling 50-period EMA (five minute) at $124.20.
As of this writing, a 50-cent (roughly five-point move in the @ES futures) erupted from the breakout at $124.20, and a 70-cent move launched off $124 (as much as we want to, you can’t buy the bottom tick but only as price comes back up off support).
Main Lesson Here
Take into account key levels or structure on the higher time frame first.
Then, as price interacts with those levels intraday, see if you can locate any obvious divergences in momentum or internals (better if you locate both) and then look for entry into the potential trade set-up/opportunity that arises from the—let’s say—positive divergence into support on the higher time frame.
By Corey Rosenbloom, trader and blogger, AfraidToTrade.com
I’ll be discussing these types of set-ups in a presentation on “Trade Execution Tactics” at the New York Trader’s Expo, February 20-23, and I hope you can join us all there.


