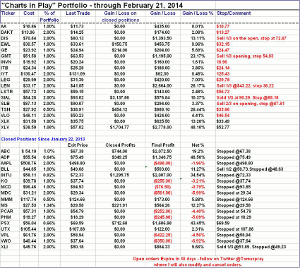
A review of the Charts in Play portfolio over the weekend prompted MoneyShow’s Tom Aspray to take stock and make adjustments to it, especially after last month’s severe decline.
The stock market seemed to lose upside momentum last week as most of the major averages closed with minor losses for the week. The Nasdaq 100 was up slightly but did form a doji last week, which is a sign of indecision.
Asian stocks were lower in reaction to weaker-than-expected housing price data out of China. There are slight losses in early European trading but the US futures are higher. The weekend review of the daily technical studies did reveal some loss of upside momentum but no sell signals. The strong market internals suggest that a correction should be well supported.
The severity of the eight-day decline in late January dropped many stocks and ETFs below the mid-December lows. I thought that the stronger stocks would hold above these lows. This made holding onto long positions more difficult as even some wide stops were hit.
When a correction is expected, Take a Proactive Portfolio Approach, I do generally recommend taking profits on full positions and then recommend stops based on my view of the individual stock or ETF’s intermediate-term outlook. The portfolio review (see page 3) indicates that in hindsight many of my stops were apparently too wide. The decline in some of even the strongest stocks was severe enough that I gave up too much of the open profits.
We did establish some new long positions on the correction and a careful review of the portfolio indicates that further adjustment should now be made to the portfolio.
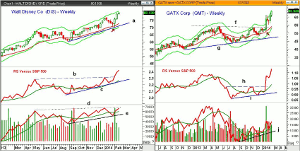
Chart Analysis: The Walt Disney Co. (DIS) peaked at the start of January and then declined for the next five weeks as it briefly violated monthly support at $70.21.
- DIS hit a correction low of $69.85 but it held above December’s low of $68.47.
- The 20-week EMA was violated before DIS rallied sharply on February 5 in reaction to its strong earnings.
- The monthly starc + band is at $82.74 with the quarterly projected pivot resistance at $85.97.
- The weekly relative performance has broken through major resistance confirming it is still a market-leading stock.
- The weekly on-balance volume (OBV) has moved back above its WMA but is still below resistance at line e.
- The volume has declined over the past two weeks but the daily technical studies are positive.
- For February, the monthly pivot support is at $76.81 with weekly chart support at $75.57.
GATX Corp. (GMT), part of the strong Dow Transportation Average, provides marine and rail rental and leasing services. It was featured in 3 Transport Picks Ready to Breakout.
- GMT traded in a tight range in late December and early January but held above its 20-week EMA before surging.
- It started the New Year above the quarterly pivot at $50.09.
- The weekly starc+ band has been tested over the past several weeks.
- For February, the monthly projected pivot resistance is at $69.12.
- The weekly chart shows a completed continuation or flag formation (My Favorite Chart Patterns), lines f and g.
- The relative performance has also completed its bottom formation, lines h and i.
- The RS line is rising very sharply as GMT is clearly a market leader.
- The weekly OBV is positive as it shows a solid uptrend with support at line j.
- The OBV is well below the early 2013 highs.
- The daily studies are very strong but are getting overextended.
- Initial support is in the $60-$61 area with stronger in the $58 area.
NEXT PAGE: Portfolio Adjustments Made
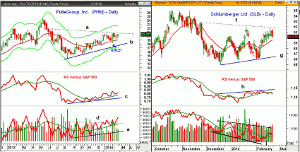
|pagebreak|PulteGroup, Inc. (PHM) wins the award as my most frustrating trade of the past two months.
- The long positions established at an average price of $19.71 were stopped out at $18.29 as PHM spiked to a low of $18.21 on Jan 27.
- When I recommended it in early January, the chart suggested that the correction was over.
- The weekly chart shows that PHM has still not broken out above the resistance, line a, at $20.75.
- The quarterly pivot resistance is at $22.16 with the weekly starc+ band at $22.54.
- The relative performance is still in a solid uptrend, line c, indicating it is doing better than the S&P 500.
- The weekly OBV looks much stronger as it broke through resistance at line d, retested its WMA, before surging to the upside.
- The OBV has held above its weekly WMA since early December.
- There is good support now in the $19-$19.50 area.
Schlumberger Ltd. (SLB) dropped to a low of $85.51 in early February, which was just above the January low of $85.39. The quarterly projected pivot support is at $84.77.
- The rally has tested the resistance in the $91.80-$92.80, line f, but closed weak Friday.
- The 20-day EMA is at $89.40 with further support in the $88 area.
- The daily relative performance deteriorated last week as it dropped below its WMA.
- The RS line was unable to surpass the resistance at line h.
- The daily OBV is above its WMA but failed to move above the resistance at line i.
- The weekly OBV (not shown) has turned down after testing its flat WMA.
- The pattern of lower lows in the OBV, line j, is also negative.
What It Means: For both Walt Disney Co. (DIS) and GATX Corp. (GMT), I recommended selling 1/3 of the position on the opening Monday, February 24, as both positions have nice quick profits.
As for PulteGroup, Inc. (PHM), the problem was my strategy. In hindsight, I should have made the entry closer to the pivot at $18.71, which would have allowed a stop under $18. I still like the stock and would look for a pullback to buy. I still like the homebuilders as Lennar Corp. (LEN) is doing quite well.
The action in Schlumberger Ltd. (SLB) makes me quite cautious so I would sell 2/3 of the position on the opening and use a stop at $87.81 to lock in a profit on the remaining position.
How to Profit: No new recommendation
Portfolio Update: For Walt Disney Co. (DIS), long from $70.84, sell 1/3 on the opening. Stop at $72.67.
For GATX Corp. (GMT), long from $51.58, sell 1/3 on the opening. Stop at $54.93.
For Schlumberger Ltd. (SLB) sell 2/3 on the opening with a stop at $87.81 on the remaining position.
All recommendations Tweeted before the opening.
NEXT PAGE: The Charts in Play Portfolio
|pagebreak|


