After gold’s and the miners’ miserable 2013 performance, their recent gains have gotten quite a bit of attention, so MoneyShow’s Tom Aspray explores whether this latest rally has legs.
Stocks are trading lower overnight as another weak report on China’s manufacturing is again making the markets nervous. The Asian markets were hit hard with Japan’s Nikkei 225 down over 2%. So far, the losses in Europe are less severe, with the German Dax down just over 1%. The US stock index futures are just a bit lower in early trading.
The strength of last week’s rally cleared out most of those who were on the short side, so after Friday’s close, I was looking for a pullback or some consolidation. This is consistent with my view that new buyers are waiting for lower levels to buy.
Traders and investors have been quite frustrated by the wide market swings over the past few weeks. The strong readings from the market internals continue to indicate that a correction will be a good buying opportunity in the next week or so.
The precious metals have gotten quite a bit of attention in the past few weeks, and at the recent Traders Expo New York, it was hard to find an analyst that was not bullish on the metals. Gold was lower, Wednesday, but is a bit higher in early trading on Thursday.
A detailed look at the weekly and daily technical outlook for both the SPDR Gold Trust (GLD) and Market Vectors Gold Miners (GDX) should help you decide whether you should be buying , selling, or looking for an entry point.
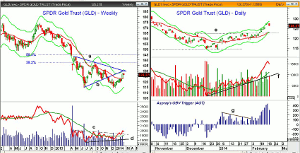
Chart Analysis: The weekly chart of the SPDR Gold Trust (GLD) shows the completion of the weekly flag formation, lines a and b, last November as the bull trap slammed shut.
- The rally is now getting close to the converging resistance in the $130 area.
- A close back above the early November high at $131.44 would be a positive sign.
- The major 38.2% Fibonacci retracement resistance is at $137.50.
- The weekly OBV did form a positive divergence at the recent lows, line d.
- This divergence was confirmed by the move through the resistance at line c.
- Even higher volume is needed to signal upward acceleration.
- There is weekly support now at $123.47 and the 20-week EMA with the quarterly pivot at $120.67.
The daily chart of the SPDR Gold Trust (GLD) shows that the daily starc+ band was tested on Tuesday as a doji was formed.
- Then a low close doji was triggered with Wednesday’s close below Tuesday’s doji low.
- A move back above the doji high at $127.75 is needed to reverse this signal.
- There is chart support (line e) and the 20-day EMA now in the $122.80 area.
- The minor 50% support calculated from Tuesday’s high is at $121.06.
- The daily OBV has been very strong on the rally but has turned lower.
- The OBV has initial support at its WMA and then at the uptrend, line f.
- The Aspray’s OBV Trigger (AOT) did confirm the recent highs but dropped Wednesday.
- The move in the AOT above the resistance (line g) signaled the recent rally.
NEXT PAGE: Gold ETF to Watch
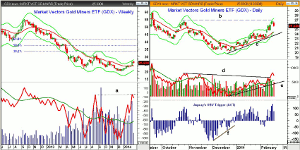
|pagebreak|The weekly chart of Market Vectors Gold Miners ETF (GDX) shows that it came close to its weekly starc+ band last week. This week, the band is at $27.42.
- There is additional resistance at $28.64 and then the August high of $31.35.
- The major 38.2% Fibonacci retracement resistance from the late 2012 high is at $33.12.
- The weekly on-balance volume (OBV) made slightly higher highs, line a, but looks ready to turn lower this week.
- The OBV is quite a ways above its flat WMA that could be tested on a correction.
- There is weekly support at $24.04 and the flat 20-week EMA.
- The quarterly pivot at $22.76 should be more important support.
- The weekly starc- band is at $20.86.
The daily chart of the Market Vectors Gold Miners ETF (GDX) also has tested its daily starc+ band and the resistance, line b, from late October.
- GDX formed a doji last Friday and then triggered a LCD on Wednesday’s close.
- There is next good support at $24.40, which corresponds to the 20-day EMA and daily starc- band.
- The uptrend that goes back to the December lows, line c, is at $23.70.
- The stronger support on the daily chart in the $22.87 to $23.07 also encompasses the quarterly pivot.
- The OBV on the recent rally was not as strong as the OBV on GLD.
- The volume did pick up on Wednesday and the OBV could drop back to its WMA and the uptrend, line e.
- The AOT formed a bullish divergence at the lows, line f, before generating a strong buy signal at the end of the year. It did make new highs last week and is now well above the zero line.
What It Means: On a short-term basis, the bullish sentiment on gold, the gold miners, as well as silver, seems to be a bit too high. The doji sell signals, unless reversed, are also consistent with a correction.
Unless there is another bout of global fear, I would expect the correction to last a week, if not more. I will be monitoring the SPDR Gold Trust (GLD), Market Vectors Gold Miners ETF (GDX), along with the iShares Silver Trust (SLV) for new entry points.
Keep your eye on my Twitter feed, along with my daily column, for new recommendations.
How to Profit: No new recommendation.


