As the US endures one of the worst winters in a long time, MoneyShow’s Tom Aspray examines a sector entering its season of strength, looking for potential buy candidates.
The stock market showed good strength on Thursday with nice gains across the board. The Nasdaq 100 led the way with a 1.8% gain. The market internals were strong so the McClellan oscillator has turned higher but it normally goes well below the -170 area before a sustainable bottom is formed.
The negative tone has resumed overnight as the Euro emerging market currencies, like the Hungarian forint, have also now come under pressure. Outflows for the emerging markets hit an all-time record last week. The German Dax Index is down 1.4% and the US futures have broken to new lows for the week before the New York opening. On a daily close in the cash S&P 500 below 1767, the next support is in the 1747-1750 area.
One sector that has been under pressure, so far in 2014, has been the energy sector as the S&P Energy Sector is down 4.9%. However, the weekly volume analysis of crude oil suggests a bottom is being formed as we approach a seasonally strong period. There is one sector and industry-leading stock that should continue to lead the sector higher.
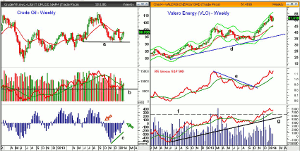
Chart Analysis: The weekly chart of crude oil shows that prices have rallied for the past three weeks while stocks have moved lower.
- The March contract is up 7.4% from the January 9 lows and it could close back above its 20-week EMA.
- Prices are also bumping into the quarterly pivot at $97.57 with the late December high at $100.79.
- The volume has been positive for the past three weeks as the OBV is ready to close back above its WMA after dropping back to support at line b.
- The Aspray’s OBV Trigger (AOT) bottomed in November and has continued to improve, line c.
- It will move back above the zero line this week (green arrow) for the first time since it triggered a sell in October (red arrow).
Valero Energy (VLO) is up 3%, so far in 2014, after gaining over 50% in 2013. The weekly chart shows that the starc- band was tested in early January with the high at $53.45.
- VLO has consolidated and corrected slightly since then, which is typical when a starc band is reached.
- VLO came close to the monthly pivot point at $48.49 on Wednesday before turning higher.
- The 20-week EMA is at $45.38 with the quarterly pivot at $44.76.
- The weekly relative performance broke its downtrend, line e, in October as the stock surged from the low at $33.20.
- The RS line still looks strong as it did confirm the highs and has turned up once more.
- The weekly OBV staged an impressive breakout in November as it moved above the February highs,
line f. - The weekly starc+ band is at $56.23 with the quarterly projected resistance at $62.17.
NEXT PAGE: An Energy Stock to Watch
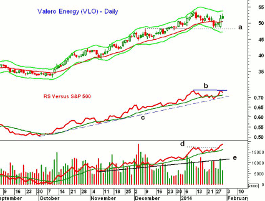
|pagebreak|The daily chart of Valero Energy (VLO) shows that the support from mid-December, line a, was tested this week. On a short-term basis, there is support at $50.20.
- There is additional support at $48.00-$48.60 with the daily starc- band at $47.20.
- VLO had lows in the $44.53 to $45.09 area in early December low.
- The daily RS line has not yet made new highs, line b, but is above its WMA and support at line c.
- The daily on-balance volume (OBV) broke out to new highs on Wednesday as the early 2014 highs, line d, were overcome.
- The uptrend in the OBV, line e, is well below current levels.
- Once above the previous high, the 127.2% Fibonacci target is at $54.91.
What It Means: The action in crude oil does favor an improving outlook for the energy sector, though the Select SPDR Energy (XLE) still looks weak technically. The review of the market leading sectors ETFs yesterday highlighted some support levels that investors and traders should now be watching.
I would be looking to buy Valero Energy (VLO) on a pullback towards the recent lows, though a stop will need to be placed well under this week’s lows. This is a higher-risk trade as it is based in part on my expectations of a more sustainable market rally in the next week.
How to Profit: For Valero Energy (VLO), go 50% long at $48.86 and 50% long at $47.36, with a stop at $45.61 (risk of approx. 5.2%).


