After heavy losses last week, the markets rebounded strongly yesterday, and MoneyShow’s Tom Aspray takes a technical look at a lagging industry group to see whether or not now is a good time to buy.
Turkey’s surprisingly large increase in interest rates after the New York close has further calmed the fears that have dominated the markets since last week. The higher close, Tuesday, was the start of the rally that was expected after Friday’s close but will the FOMC announcement short circuit the rally?
The increase in the Consumer Confidence to its best level since August and the best yearly increase in the S&P Case-Shiller Housing Price Index since 2006 helped boost stocks. Traders seemed to ignore the weaker-than-expected Durable Good Orders.
Most of the short-term technical studies, like the McClellan oscillator have turned higher, closing at -76, up from -164 on Monday. It will take a stronger and longer rally to reverse the deterioration from last week so the rebound could stall this afternoon or by the end of the week.
It is a positive that the NYSE Composite has turned higher after testing the uptrend from the June lows. The next band of resistance for the S&P 500 is in the 1802-1812 area. On the downside a daily close in the S&P 500 below 1767 will signal a drop to the 1750 area.
The market-leading Nasdaq 100 was lower for the day while the best performer was the homebuilders, with the iShares Dow Jones Home Construction ETF (ITB) up 3.8%, as robust earnings from DR Horton Inc. (DHI) pushed it 9.8% higher.
The home-construction stocks peaked in May and a higher weekly close on Friday will suggest that their correction is finally over.
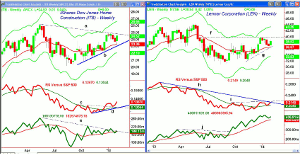
Chart Analysis: The weekly chart of the iShares Dow Jones Home Construction (ITB) shows that it peaked at $26.19 and hit a low of $20.18 last August.
- The chart shows a solid uptrend from the lows, line b, as ITB has dropped below its 20-week EMA ($23.36) this week.
- The quarterly pivot at $23.52 was violated on Monday with monthly projected pivot support at $23.03.
- The weekly downtrend is at $23.78 with the early January high at $23.98.
- The weekly relative performance has completed its bottom formation indicating that it is now a market leader.
- The RS line formed higher lows before moving above resistance at line c.
- The RS line has now turned up from its rising WMA and should make higher highs this week.
- The weekly OBV slightly broke its downtrend, line e, in early 2014 but looks ready to close back its WMA this week, which would trigger an AOT buy signal.
- The 127.2% Fibonacci upside target for ITB is at $27.78.
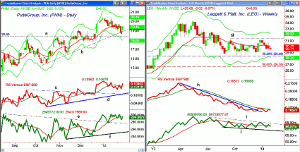
Lennar Corporation (LEN) closed below its quarterly pivot at $37.21 last Friday before reversing back to the upside. A higher close this week and back above the pivot would support the bullish case.
- The weekly chart shows strong resistance in the $40 area, line f.
- The weekly starc+ band is at $43.35 with the May high at $44.24.
- The 20-week EMA and the short-term uptrend, line g, were tested with Monday’s low of $36.41.
- The relative performance has turned up from its WMA and it is now testing the downtrend, line h, from the early 2013 highs.
- The RS line has also reached the resistance from last fall, line i, which needs to be overcome to signal it is a market leader.
- The on-balance volume (OBV) completed its bottom formation last September as it overcame the five-month resistance at line j.
- The daily OBV also completed its bottom formation last September (see chart)
- The daily studies do suggest that a bottom is in place.
NEXT PAGE: 2 Homebuilders to Watch
|pagebreak|The daily chart of PulteGroup, Inc. (PHM) shows a pretty normal correction from the late 2013 high of $20.49.
- It dropped below support at line a in Monday’s session. It also came close to the daily starc- band.
- There is next resistance now at $19.76 and then at $20.49 with the 2013 high at $24.33.
- The daily relative performance broke through resistance, line c, last November.
- The RS line is back above its WMA and the weekly RS analysis (not shown) has also completed its bottom formation.
- The daily OBV broke through its resistance (line e) in December and has held up well on the correction suggesting the selling was not on heavy volume.
- The weekly AOT will trigger a buy signal with a higher close this week.
Leggett & Platt, Inc. (LEG) is a $4.38 billion dollar home furnishing and fixture company. It has a current yield of 4.0% as its EPS for 2013 improved by 5% over 2012 as reported last week.
- The weekly chart shows that prices have been consolidating below the resistance at $39.88, line g.
- The weekly starc+ band is at $32.23 while the high in 2013 was $33.29.
- The major 38.2% Fibonacci support at $28.49 from the 2012 lows was briefly broken in October.
- The 20-week EMA is at $30.12 and a close back above it would be a plus.
- The weekly relative performance broke its downtrend (line h) in December.
- A close in the RS line back above its WMA would be positive and the daily RS (not shown) is above its WMA.
- The weekly OBV is now back below its WMA and has more important resistance at line i.
- The daily OBV (not shown) is below its WMA and needs a move above last week’s highs to turn positive.
What It Means: A higher weekly close will indicate the correction in the many of the homebuilders and ITB is clearly over. If instead stocks and the homebuilders finish the week lower, then it will be a sign that more consolidation is needed before this industry group can rally sharply.
New long positions were recommended in early January, and I would wait for a higher weekly close before doing new buying. Also I am watching for clear signs that the SPDR Homebuilder ETF (XHB) has bottomed as well as looking for a new entry point in PulteGroup, Inc. (PHM).
How to Profit: No new recommendations
Portfolio Update: Should be long Lennar Corp. (LEN) at $33.17, and on the move above $39.50, the stop was raised to $36.22.
Should be 50% long iShares US Home Construction ETF (ITB) at $24.34 and 50% at $23.77, with a stop now at $22.87.
Should be long Leggett & Platt, Inc. (LEG) from $29.99 with a stop at $28.49.
The longs in PulteGroup, Inc. (PHM) from $19.27 just stopped out at $18.29.
The longs in MDC Holdings (MDC) from $31.21 were stopped out at $29.34.


