Continued strength in the stock market has important implications for stocks and ETFs in the first quarter and using a numbers-based strategy is the key to avoiding emotional reactions to the news, says MoneyShow’s Tom Aspray.
It has been just three months since the government shutdown and the last panic selloff in the stock market. Since October of 2008, there have been a series of sharp market declines that were exacerbated by the divisive atmosphere in Washington.
Now that the budget has been passed, we have only the debt ceiling to worry about. This will need to be dealt with before the end of February. Those investors who are skeptical that Congress has learned its lesson will need an objective method to keep them from reacting emotionally to any market moving news.
In October’s column Avoid the Noise, Watch the Numbers, I suggested that investors use the quarterly pivot levels to help them decide when to buy or sell. This, I think, will help one avoid the panic waves of selling that come in reaction to either government action or an economic report.
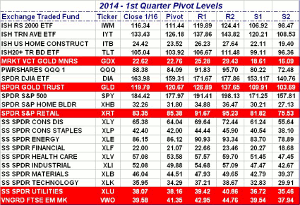
As we finish the second full week of trading in the 1st quarter of 2014, all except five of the ETFs, are above their quarterly pivots. Two ETFs could flip back to positive on a higher close, Friday, as a weekly close above or below the quarterly pivot level can signal that a trend change has occurred.
I suggest that you keep a copy of this table as I think it will be useful as the quarter progresses. Using a pivot calculator, like the one provided by John Person can make it easy to calculate the quarterly pivot levels for any individual holdings. The analysis of these two key ETFs demonstrates how this approach has worked over the past year.
NEXT PAGE: Pivot Analysis of SPY and XLV
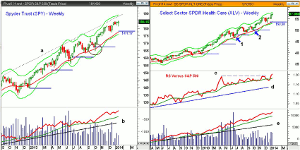
|pagebreak|Chart Analysis: On the weekly chart of the Spyder Trust (SPY), I have added in the quarterly pivot levels since the start of 2013.
- One can also compare the price action to the rising 20-week EMA, which was briefly broken three different times in 2013.
- On the correction from the May highs, the SPY dropped well below its WMA but did not close below it.
- The correction low was $155.73 but SPY held well above 2nd-quarter pivot level at $151.73.
- In October, the 4th quarterly pivot was violated on October 8 and 9 but then SPY closed the week at $170.26 (see circle) that was well above the pivot at $167.28.
- For the 1st quarter the pivot is at $177.97.
- The weekly on-balance volume (OBV) looks ready to make another new high with prices and the R1 resistance for the 1st quarter at $191.41.
- The OBV is well above its WMA and the support at line b.
The weekly chart of the Sector Select Health Care (XLV) shows that it opened 2013 at $40.23, which was well above the 1st quarter pivot of $39.43.
- XLV stayed well above its pivot for the first half of the year but traded below it at the start of the 3rd quarter (point 1).
- XLV rebounded to close the first week of July at $48.22, which was back above the pivot at $47.80.
- The 4th quarter pivot was also briefly violated in October (point 2) as the 20-day EMA was tested.
- For the first three months of 2014, the pivot stands at $53.58.
- The relative performance has just broken out above the resistance at line c.
- This signals that XLV is still leading the S&P 500.
- The weekly OBV also looks strong as it has confirmed this week’s new highs.
- On the upside the quarterly R1 resistance is at $57.57, which is 3.8% above Thursday’s close.
- If the quarterly pivot is violated on a weekly closing basis, the quarterly S1 support is at $51.35.
What It Means: As we start 2014, healthcare seems to be the “most-loved sector” and many of the big healthcare stocks will report earnings in the next few weeks. Therefore, I am watching its quarterly pivot level closely.
The PowerShares QQQ Trust (QQQ) has been leading the market higher and is well above its quarterly pivot at $84.09 with the R1 resistance at $91.83.
Two ETFS, the Market Vectors Gold Miners (GDX) and the Sector Select SPDR Utilities (XLU) could close back above their quarterly pivots on Friday.
How to Profit: No new recommendation


