Following the herd on Wall Street is often not good, says Moneyshow’s Tom Aspray, as he reviews the performance of the highest and lowest analyst-rated stocks for 2013. You may find their YTD performance quite surprising.
The new weekly closing high in the NYSE Composite has been confirmed by the weekly NYSE Advance/Decline, which is a bullish sign for the intermediate-term trend. The daily A/D line made a new high on December 23 as the major averages have accelerated to the upside.
These positive signs do not rule out a meaningful correction in the first part of 2014 as the NYSE Composite is just 2% below its monthly starc+ band. The Spyder Trust (SPY) is even further in the high- risk buy zone as it is just 1.2% below its December starc+ band.
Many individual stocks are even more overbought as last week I reviewed nine Nasdaq 100 stocks that were 8% or more above their monthly bands. This means that new buying must be done very selectively and concentrated in those stocks that have just recently joined the party.
In last January’s Wall Street's Pick and Pans, I discussed a WSJ article by Brett Arends, who noted that “buying the 10 most popular stocks each year would have brought you total losses of 11% over the past five years.” On the other hand, buying those least-popular stocks did much better “earning 16%.”
This table shows the most-popular stocks (picks) and least-popular stocks (pans) for 2013 as reported in the WSJ article. With just two trading days left in the year, the data indicates that once again the least-liked stocks did much better. H&R Block (HRB) was the best pick, up 57.89% YTD, according to Morningstar, which is one of my four favorite research sites.
Of those least-popular stocks, Netflix, Inc. (NFLX) was up over 306% while Hewlett-Packard Company (HPQ) gained over 101%. The average gain of the least popular stocks was 104.88% versus a 36.78% average gain in the five highest-rated picks.
As we enter 2014, which of these stocks now look the best?
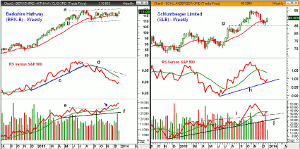
Chart Analysis: Berkshire Hathaway (BRK-B) has matched the performance of the Spyder Trust (SPY), so far this year, but has lagged by 6.6% over the past three months.
- The trading range on the weekly chart, lines and b, goes back to May.
- A close above $119.30 will be an upside breakout with upside targets from the chart in the $128-$130 area.
- The weekly relative performance indicates that BRK-B stopped being a market leader in August as the uptrend, line c, was broken.
- The RS line has resistance now at line d and its WMA while the daily (not shown) does look better.
- The weekly on-balance volume (OBV) broke out to new highs in November as it overcame resistance at line e (see arrow).
- The OBV is leading prices higher, which is a positive sign.
- There is initial support now at $116.12 and the rising 20-day EMA with the 1st quarter pivot at $115.68.
Schlumberger Limited (SLB) peaked at $94.57 in October and is still 4.9% below this high. SLB made a low of $84.91 two weeks ago (line g) but closed strong last week.
- It is well above its 20-week EMA at $87.67 with the 1st quarter projected pivot support at $85.02.
- The relative performance has turned up from potential support at line h.
- The daily RS line does appear to have bottomed as it has moved back above its WMA.
- The weekly OBV made significant new highs in October before pulling back to test important support at line i.
- The OBV is barely back above its WMA and well above support at line j.
- The daily OBV (not shown) could pull back to its WMA to complete its bottom formation.
- The preliminary 1st quarter pivot is at $89.90 and a weekly close above this in January would be a positive sign.
NEXT PAGE: A Stock to Watch, a Stock to Buy
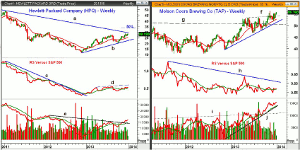
|pagebreak|Hewlett-Packard Company (HPQ) was considered by many to be “dead and buried” in early 2013 but has rallied to new highs after dropping into the 38.2-50% Fibonacci support zone in October.
- HPQ is now testing the downtrend, line a, from the April 2010 high of $54.75.
- The major 38.2% Fibonacci resistance at $27.85 has been overcome with the 50% resistance at $33.02.
- The weekly relative performance broke its downtrend, line c, in December 2012, completing its bottom in February.
- The RS line now has resistance at line d, which when overcome, will reaffirm it as a market leader.
- The weekly OBV has made new highs for the year after breaking through resistance at line e.
- The OBV is well above its rising WMA but the daily OBV (not shown) has not yet moved the August highs.
- The January pivot is at $26.51 with further support at $24.84.
- There is more important weekly chart support in the $23.50 area.
Molson Coors Brewing Co. (TAP) looks ready to slightly outperform the Spyder Trust (SPY) in 2013 as it overcame resistance from 2009-2010, line g, in early 2013.
- There was another surge in TAP this fall as the prior highs (line f) were also overcome.
- The 1st quarter projected pivot resistance is at $60.65 with the monthly starc+ band at $60.35.
- The rising 20-week EMA was tested in early December and is now at $52.79.
- The weekly uptrend is now at $51.40, which is very close to the quarterly projected support at $51.37.
- The relative performance is still in a long-term downtrend, line h, but has been in a narrow range for most of the year.
- This is consistent with a stock that is keeping pace with the S&P 500.
- The weekly OBV gives a much different picture as it surged sharply above resistance (line i) in the middle of the year and is acting much stronger than prices.
What It Means: The conclusion of the original article was confirmed again this year. This is an important lesson for investors as the more highly touted stocks should be treated with caution as many have already bought these stocks leaving fewer buyers on the sidelines.
As to the other stocks, Netflix, Inc. (NFLX) is one of the most overbought Nasdaq 100 stocks. SLM Holding (SLM), Andarko Petroleum (APC), and Waste Management (WM) are all looking toppy. The weekly charts of H&R Block (HRB) and Hormel Food (HRL) are neutral.
I like all four of the featured stocks but have no recommendation for Hewlett-Packard Company (HPQ) as I will be watching it on a correction.
How to Profit: For Berkshire Hathaway (BRK-B), go 50% long at $116.62 and 50% at $114.77, with a stop at $110.38 (risk of approx. 4.6%).
For Schlumberger Limited (SLB), go 50% long at $87.72 and 50% at $86.54, with a stop at $82.71 (risk of approx. 5.0%).
For Molson Coors Brewing Co. (TAP), go 50% long at $53.64 and 50% at $52.78, with a stop at $50.87 (risk of approx. 4.4%).


