The long-awaited and often-dreaded Fed tapering was finally announced yesterday, and MoneyShow’s Tom Aspray explores whether market participants should change their game plan because of it.
The Fed lit a fuse under the stock market on Wednesday as their decision to alter their bond-buying strategy seemed to hit a perfect balance as far as the markets were concerned. I had been arguing that they would not make any changes because of deflationary fears and was clearly on the wrong side of this one.
Does this mean that investors or traders should change their strategy in reaction to the Fed’s action? In my opinion, this depends on your time frame as clearly the short-term market momentum is now positive. However, on an intermediate-term basis, there are still signs that we are currently at high-risk levels in the major market averages.
So what does this mean? A rally in the S&P 500 to the 1860-1870 area is clearly a possibility, which would mean a further 2.6% gain in the Spyder Trust (SPY). In order to participate in this rally you may have to be quite nimble as I still think a 5-10% correction is very likely in the first part of 2014.
Therefore, new purchases should be made with strict attention to the risk as those stocks like Lennar Corp. (LEN), which was purchased near the year’s lows have less risk than those current market leaders that are already up 50-70% YTD. The homebuilders were one of the big winners, Wednesday, with LEN up over 6% on heavy volume. These stocks peaked in May and have significant upside potential if bought on a pullback.
The long-term impact of the Fed’s action, however, should be positive for the stock market. All data suggests that a majority of the public is still under invested, and I think this should be a good year for the asset managers as the group broke out to new highs on Wednesday. Let’s look at the technical evidence.
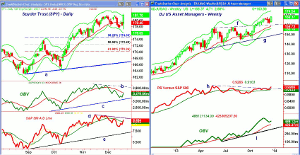
Chart Analysis: The daily chart of the Spyder Trust (SPY) shows a broad range as it dropped below last week’s lows before closing sharply higher. The close was just barely below the November 28 high.
- The daily starc+ band is now being tested with the weekly at $187.30.
- A completion of the trading range has upside targets in the $186-$187 area.
- The volume was twice the average on Wednesday but the daily OBV is still below its WMA.
- The bearish divergence resistance at line b needs to be overcome to confirm a new uptrend.
- The market internals on the NYSE were 3 to 1 positive and the S&P 500 A/D line has moved back its WMA.
- The A/D line has next resistance at the negative divergence resistance at line d.
- There is initial support at $179.80 and then at $179.40, which corresponds to the 20-day EMA.
The DJ US Asset Managers (DJUSAG) broke out of its recent trading range with Wednesday’s close.
- It is up over 42% for the year as it completed its flag formation, lines f and g, in late October.
- The weekly starc+ band is now at $174.57.
- The upside targets from the flag formation are in the 180 area, which is about 13% above current levels.
- The weekly relative performance is now above resistance at line h after testing its WMA.
- The weekly OBV looks even stronger as it broke out in September and broke out ahead of prices.
- There is initial support now at 160-161.50.
NEXT PAGE: 2 Asset Manager Picks
|pagebreak|Northern Trust Corp. (NTRS) provides a wide range of asset management services and has a capitalization of $14.2 billion with a current yield of 2.10%.
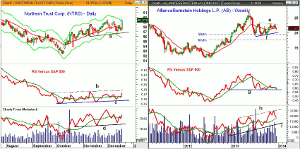
- NTRS is up 20.8% YTD but 13.3% since the October low of $52.40.
- The close Wednesday was at the starc+ band with the weekly at $62.33.
- The 2013 high was at $62.02 with the early 2009 high at $66.08.
- The daily relative performance is trying to complete its bottom formation, lines b and c.
- A move in the RS line above line b would confirm it.
- The daily OBV tested short-term support at line d last week and is back above its WMA.
- The weekly and monthly OBV (not shown) are positive.
- There is minor support at $58.30 with stronger in the $56.60-$67 area, line a.
AllianceBernstein Holdings L.P. (AB) is a $2.0 billion asset manager that currently yields 7.43%.
- It is up 31.9% YTD but is still well below the 2013 high of $25.38.
- The weekly chart shows an apparent continuation pattern, lines e and f, with key resistance at $22.84.
- On the decline into the July low at $18.10, the 50% Fibonacci retracement support at $18.34 was slightly violated.
- The relative performance is testing long-term support at line g and did confirm the recent highs.
- The weekly OBV formed a short-term bullish divergence at the 2012 lows (see circle) and has been acting stronger than prices, line h.
- The OBV has pulled back to its WMA and has stronger support at line i.
- A higher weekly close could cause the OBV to form a bullish set-up.
- Initial support now at $21 with stronger at $20-$20.60.
What It Means: The best news from the FOMC announcement was that they felt the economy has continued to improve and it has always been my view that it will get even better in 2014.
This should convince more individuals to get back into the stock market, and many will turn to asset managers like Northern Trust Corp. (NTRS) and AllianceBernstein Holdings L.P. (AB).
I also think the transportation stocks will do well in 2014 and two of its industry groups, as I mentioned recently, are looking especially strong.
How to Profit: For Northern Trust Corp. (NTRS), go 50% long at $58.56 and 50% at $58.02, with a stop at $55.62 (risk of approx. 4.5%).
For AllianceBernstein Holdings L.P. (AB), go 50% long at $21.24 and 50% at $20.76, with a stop at $19.98 (risk of approx. 4.9%).


