If you're looking for some post-Cyber-Monday bargains, this sector is not the place to go shopping, notes MoneyShow's Tom Aspray.
The weak opening in US stocks Tuesday was consistent with the deterioration in the technical studies and sharply lower European market averages. The major US averages were able to close well above the day's lows and the market internals were not too negative.
The selling continued in Asia overnight with over a 2% loss in the Nikkei 225 but the Euro markets are flat in early trading as are the US futures. The technical studies discussed yesterday are still holding above key support and have not generated stronger sell signals.
One market that did not get much attention was crude oil, which gained well over $3 a barrel. If it can hold its gains by Friday's close, it is likely to signal a bottom for crude oil, which had dropped 15% from the late August highs.
A week before retail's Black Friday, several analysts, including Barron's, were voicing the opinion that some of the big retailers were selling at discounts and therefore were bargains. The recent 10% surge in Tiffany & Co. (TIF) and the buyout offer for Jos. A Bank Clothiers Inc. (JOSB) has turned the focus on retail.
Though many of these retail stocks could still be even higher in the next year, the technical outlook indicates that several from the Barron's article look vulnerable to a significant pullback in the next month or so.
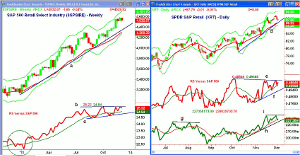
Chart Analysis: The weekly chart of the S&P 500 Retail Select Industry (SPSIRE) has been in a powerful uptrend since late 2012 as it is up 48.3%.
- The weekly chart shows the strong surge three weeks ago as it closed very near its weekly starc+ band. It is now just 3.7% below this resistance.
- A close below the prior two-week low at 4416 will
signal that a correction is underway.
- The weekly uptrend, line a, is at 4342 with the rising
20-week EMA at 4300.
- This is about 5% below current levels.
- The weekly relative performance completed its bottom formation
(see circle) in early 2013.
- The RS line has failed to confirm the new highs as it
has failed to move above the early October highs, line b.
- A drop in the RS line below its WMA and support at
line c, would be more negative.
- The daily RS line (not shown) also has not yet
confirmed the price action.
The SPDR S&P Retail (XRT) contains 98 stocks with the ten largest holdings making up just 11% of the ETF. It is up 41.4% YTD.
- XRT made a marginal new high last week at $88.95,
which was just below the quarterly R3 resistance at $89.68.
- A daily LCD sell signal was triggered with Monday's close at
$87.87.
- Tuesday's close is not far above monthly pivot at
$87.00.
- The daily uptrend (line d) and the rising WMA are at
$86.92 with the monthly projected pivot support at $85.05.
- XRT has been above its quarterly pivot all year and it
now stands at $80.99.
- The daily relative performance has turned up from its
WMA but is still below the resistance at line e.
- The daily OBV has formed a short-term negative
divergence, line i, that would be confirmed by a drop below support at line
h.
- In early August, a similar divergence was formed, line
g, which led to a 7.2% correction.
- There is resistance now at $88.95 with the daily
starc+ band at $89.68.
NEXT PAGE: 2 Topping Retail Stocks
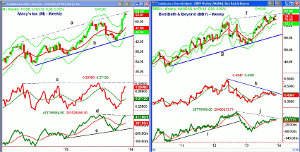
|pagebreak|Macy's Inc. (M) was higher Tuesday, despite the overall market weakness and is up just over 37% YTD. The weekly chart shows a well-defined trading channel (lines a and b) as the upper boundary is being tested.
- The close last week at $53.26 was above the weekly
starc+ band at $52.96.
- The quarterly R2 pivot resistance at $53.72 was just
exceeded.
- For December, the monthly starc+ band is at $56.17.
- The weekly relative performance is well above its
rising WMA but is still well below the prior two weekly highs, line c.
- The weekly on-balance volume (OBV) has turned down and also shows
a negative divergence as it has not confirmed prices, line d.
- The OBV could pull back to its WMA and support at line
e.
- The daily technical studies are positive and have not
yet confirmed that a top is in place.
- The monthly pivot is at $50.96 with the monthly
projected pivot support at $47.82.
- There is a large gap in the $47.31-$49.19 area.
Bed Bath & Beyond (BBBY) has also had a great year as it is up 39.7% YTD but is still below the mid-November high of $78.94.
- The rally in September failed at $78.88 with weekly
trend line resistance, line f, in the $80 area.
- The weekly starc+ band is at $82.69.
- The relative performance has formed sharply lower
highs, line h, as it has diverged from prices.
- The RS line is also now below its declining WMA.
- The weekly OBV broke below two-year support, line i,
in the latter part of 2012, which is a sign of weakness.
- The OBV is now above its rising WMA but is well below
its late 2012 high, line j.
- The daily OBV (not shown) is still positive.
- BBBY did have a weekly close below its quarterly pivot at $75.90 in November before
rebounding.
- This is now an important level of support with further
at $74.84-$75.04.
What It Means: The daily technical studies have not yet confirmed a top in the SPDR S&P Retail (XRT), Macy's Inc. (M), or Bed Bath & Beyond (BBBY). The weekly analysis does suggest all three are vulnerable to a 3-5% correction, if not more. Therefore, holders of these stocks should consider taking some profits or employing some risk control.
On a longer-term basis, SPDR S&P Retail (XRT) and Macy's Inc. (M) look the most attractive but do not look cheap or discounted at current levels.
How to Profit: No new recommendation


