Success in the stock market is largely dependent on managing risk, so MoneyShow’s Tom Aspray offers two picks that are presenting attractive entry levels.
The stock market broke out to the upside Wednesday as the Spyder Trust (SPY), SPDR Dow Industrials (DIA), and PowerShares QQQ Trust (QQQ) all closed above the previous swing highs. The S&P 500 Advance/Decline made new highs but the other major A/D lines have not yet.
Unless we reverse to the downside in equal magnitude today, this suggests that the S&P 500 cash should test, if not exceed, the 1800 level with quarterly R2 resistance at 1801. Many sectors were strong Wednesday as the Select Sector SPDR Health Care (XLV), Select Sector SPDR Consumer Discretionary (XLY), Select Sector SPDR Technology (XLK) and Select Sector SPDR Industrials (XLI) all closed at new highs for the year.
This is a leadership group that despite the “bubble fears” from some could fuel a tradable rally even from the current lofty levels. There are quite a few stocks and ETFs that had momentum shifts in Wednesday’s session. The ones that look the most interesting are those that closed above near-term resistance after dropping back to long-term support.
The momentum on one of my picks from Monday’s 6 Stocks Bucking the Trend article, Capital One Financial (COF) saw such a shift, which makes it unlikely my original buy levels will be hit. The new levels were tweeted before the opening. Here are two other pick where the momentum favors further gains this month
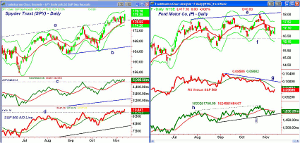
Chart Analysis: The Spyder Trust (SPY) closed Wednesday at $178.38, which was well above the prior high at $177.64. The day’s low held the former breakout level at line a.
- The daily starc+ band is at $179.76 with the upside target from the recent range at $180-$181.
- The quarterly R2 resistance is at $181.10 with the weekly starc+ band at $182.15.
- The OBV made new highs in October as the resistance at line d was overcome.
- The OBV held this support for the past two weeks and made marginal new highs Wednesday.
- The S&P 500 A/D line has also held its breakout level, line d, and has made new highs.
- There is initial support now at $176.50-$177 with stronger now at $174.70.
- The monthly pivot support is at $172.61.
Ford Motor Co. (F) reported strong sales data early in the month and its earnings beat estimates last month. The chart shows that the early October low of $16.35 was approached last week with a low of $16.53.
- This was a drop of 8.2% from the high of $18.02 on October 24.
- This was just below the quarterly R1 resistance at $18.08.
- The relative performance has turned up but is still well below its WMA and the downtrend, line g.
- The OBV shows a pattern of higher lows, line i, and has closed above its WMA.
- The OBV did make a new high in October, line h.
- The weekly OBV (not shown) is positive and continues to lead prices higher.
- The quarterly pivot is at $16.88 with Wednesday’s low at $16.64
NEXT PAGE: 1 ETF Pick
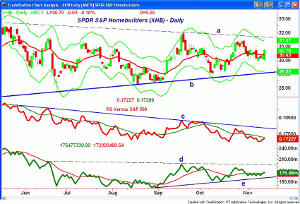
|pagebreak|Though the homebuilder stocks have not yet given new buy signals (they are close), the SPDR S&P Homebuilders (XHB) reversed to the upside Wednesday suggesting that the pullback from the late October lows was over.
- As I have mentioned previously, XHB has “44% in mid-caps and 43% in small-caps, with homebuilders making up just over 30% of the ETF. The rest is allotted to building product and home furnishing stocks.”
- This makes it more of a retail play with initial resistance at $31-$31.40.
- There is further resistance at $31.69 (line a) and then at $32.08.
- The quarterly R1 resistance is at $32.54 with the May highs just one cent higher.
- The relative performance is still below its WMA with major resistance at line c.
- The OBV has been edging higher since the September lows, line e, and is now back above its WMA.
- The OBV needs to overcome the resistance at line c, to confirm a significant low.
- Minor support is at the quarterly pivot of $30.35 and then at $29.50-$29.68.
What It Means: There are quite a few good-looking charts after Wednesday's close suggesting that the market may have more surprises on the upside. Underinvested fund managers are likely to start throwing in the towel and buying so that they won’t jeopardize their year-end bonuses.
Controlling risk is always the key and the risk on these two picks, I think, is well controlled.
How to Profit; For Ford Motor Co. (F), go 50% long at $17.02 or better and 50% at $16.68, with a stop at $16.29 (risk of 3.3%).
For SPDR S&P Homebuilders (XHB), go 50% long at $30.59 or better and 50% long at $30.34, with a stop at $29.31 (risk of 3.7%).
Portfolio Update: Order change for Capital One Financial (COF), go 50% long at $69.96 and 50% long at $69.55, with a stop at $65.15 (risk of 4.1%).
Editor’s Note: If you’d like to learn more about technical analysis, attend Tom Aspray’s workshop at The Traders Expo Las Vegas, November 20-23, 2013. You can sign up here, it’s free.


