MoneyShow’s Tom Aspray takes a technical look at stocks that were featured in a recent Barron’s article to see whether any would be good potential buy candidates.
Stocks in Asia responded positively to the better-than-expected jobs report with the Nikkei 225 closing up 1.3%. Some of the emerging markets currencies were hit in reaction to fears that the Fed will start tapering sooner than expected.
The rally late Friday helped to offset the sharp losses from Thursday’s session as another very weak close could have pushed the daily technical studies further into the sell mode. Further gains are needed early this week to indicate that the market pullback may be over. As noted in Bubble Top or Buying Opportunity?, the weekly studies continue to act strong with the OBV on the Spyder Trust (SPY) and SPDR Dow Industrials (DIA) at new all-time highs.
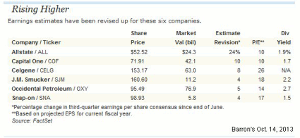
I was able to catch up on my reading over the weekend and found an interesting article in Barron’s by Jack Hough, Six Stocks with Rising Earnings Estimates, that was published in the middle of last month. In the article, he focused on six stocks (see table below) that upwardly revised their earning’s estimates.
I took a look at these six stocks from a monthly, weekly, and daily technical perspective to see if any looked attractive for new purchase or if they looked like they could be topping out.
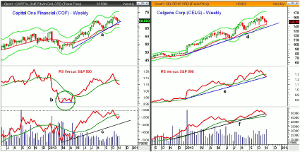
Chart Analysis: The weekly chart of Capital One Financial (COF) shows that it has had a great year as it bottomed in March with a low of $50.21. The week after the article was released (October 18th), COF had a high of $72.99 and formed a doji.
- The close the following week below the prior week’s low triggered a LCD sell signal.
- From the doji high to the recent week’s low of $68.63, COF had lost 5.7%.
- It has held above the quarterly pivot at $68.15 as the uptrend, line a, has been tested with the 20-week EMA at $67.56.
- The relative performance did confirm the recent highs but has dropped below its WMA.
- The RS completed a classic bottom formation (circle b) in April.
- The weekly OBV made slight new highs with prices but has now turned up from below its WMA.
- The monthly indicators still look strong while the daily studies are negative.
- There is initial resistance at the late October high of $71.38.
Celgene Corp. (CELG) bottomed out in the latter part of 2012 and has since shown a pattern of higher highs and higher lows.
- Three weeks ago, it made a high of $161.64 but hit a low of $148.92 last week.
- This was a correction of 7.9% but it did close last week above the quarterly pivot at $145.51.
- The monthly projected low for November is at $140.35 with the uptrend (line d) at $139.52. In August the low was $131.52.
- The weekly relative performance confirmed last month’s highs and is now testing its uptrend, line e.
- The OBV has broken its uptrend, line f, but is well above the rising WMA.
- The monthly RS and OBV both continue to look strong.
- The daily studies are negative but are trying to bottom out.
- There is initial weekly resistance at $154-$155.40.
NEXT PAGE: 2 More Stocks Bucking the Trend
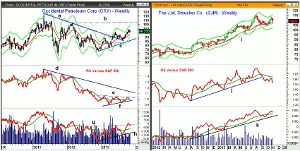
|pagebreak|Occidental Petroleum Corp. (OXY) had risen over 16% from the August low of $84.91 as the former downtrend, line a, was retested.
- This resistance was overcome in May of 2013.
- OXY has now tested the resistance at $99.50, which if overcome, will signal a move to next resistance from early 2012, line b, at $106.82.
- The weekly relative performance is trying to bottom out, line f, but needs to move above resistance at line e to signal that it has become a market leader.
- The RS line has more important resistance at the downtrend, line d.
- The weekly OBV moved above 16-month resistance (line g) last month and shows a pattern of higher lows, line h.
- The monthly OBV is positive but the RS analysis is not. This is also the case for the daily technical studies.
- Over the past four weeks, OXY has been in a tight range with monthly projected support and holding well above the quarterly pivot at $91.98.
The J.M. Smucker Co. (SJM) peaked in early August at $114.72 and triggered a low close doji the following week.
- SJM hit a low of $103.80 in early October before rebounding as the quarterly R2 at $112.94 was hit in late October.
- It does not look like the corrective pattern is complete.
- The uptrend in the relative performance, line j, was broken in early September.
- Since then, the RS has rebounded back to its declining WMA and is now in a downtrend.
- The monthly and daily RS lines are both below their WMAs.
- The weekly OBV turned lower last week but did confirm the August highs.
- The OBV is above its WMA and support at line k.
- The daily and monthly OBV are also positive.
- The quarterly pivot at $107.19 was tested last week but SJM did not close below it.
- There is additional support at $105.70 and then the October low of $103.80.
What It Means: I have often found it worthwhile to analyze stocks that show up in the fundamental scans of other analysts as they draw my attention to stocks that I have might not have normally examined.
All of these stocks, except for J.M. Smucker Co. (SJM), do look attractive, but given the current technical outlook, it will need to be at lower levels. This would change for Capital One Financial (COF) or Celgene Corp. (CELG) with a strong weekly close. This would indicate that their corrections were over.
Allstate (ALL) and Snap-On (SNP) were not covered because even though they look very strong, they are well above good support and I would not chase them.
How to Profit: For Capital One Financial (COF), go 50% long at $68.32 and 50% long at $67.54, with a stop at $65.15 (risk of 4.1%).
For Celgene Corp. (CELG), go 50% long at $141.44 and 50% long at $138.77, with a stop at $135.79 (risk of 3.1%).
For Occidental Petroleum Corp. (OXY), go 50% long at $92.77 and 50% long at $91.44, with a stop at $89.13 (risk of 3.2%).


