As stocks and indices continue to move to new all-time high levels, MoneyShow’s Tom Aspray recommends renewed vigilance and taking some profits off the table to protect hard-earned gains.
It was another new record for the Dow Industrials on Wednesday, with 27 of the 30 stocks closing higher on the day. Still the market is likely to be on edge as we get the preliminary reading on 3rd quarter GDP, the Twitter IPO, and the ECB decision on rates.
Now that over 84% of the S&P 500 companies have reported their earnings, many investors have been pleasantly surprised. According to Thomson Reuters, 68.3% of the companies have beat expectations, which is much better than the long-term average.
Still, many are glad it is ending as even those companies that exceeded their earnings expectations have seen sharp drops. Tesla Motors (TSLA) beat the quarterly earnings estimate but was down 14.5% as it delivered fewer cars than expected. Other stocks have fallen on positive earnings or rallied after earnings misses.
Most on Wall Street are aware of the strong historical performance in November and December as I pointed out in Will November Surprise the Bulls or Bears?, but that is not a reason to be complacent about your portfolio. Therefore, one should continue to raise stops and take partial profits when a position moves quickly in your favor.
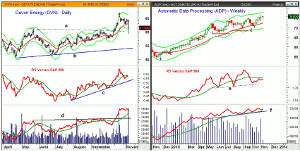
Chart Analysis: In September, Devon Energy (DVN) appeared to be forming a long-term base on the weekly chart (see chart).
- It dropped down at the end of September before accelerating to the upside.
- The 38.2% Fibonacci retracement resistance from the 2011 high at $66.98 was almost hit with the October 22 high at $66.96.
- For the next two weeks, DVN moved sideways before dropping sharply Wednesday as it beat earnings expectations but missed on revenues.
- The decline is now testing the former breakout level, line a, as the daily starc- band was violated.
- There is next strong support in the $57 to $58.23, which corresponds to the quarterly pivot and monthly projected pivot support.
- The uptrend in the relative performance, line c, is still intact.
- The volume was heavy Wednesday but still the on-balance volume (OBV) is well above support at line d.
- The weekly technical studies (not shown) are still positive.
- The daily chart shows resistance now in the $62.70 to $65 area.
Automatic Data Processing Inc. (ADP) has been a star portfolio performer since it was recommended last November (see arrow) as the weekly chart showed that it was pulling back to strong support.
- The weekly chart shows that it made new highs last week but formed a doji, suggesting indecision.
- The weekly range is $5 wide, which gives upside target in the $80 area.
- The relative performance made a significant new high in September but is now below its WMA.
- The RS line has good support at line e.
- The weekly OBV has confirmed the recent highs and has good support at line f, and its WMA.
- On the chart, I have noted prior stops as up through July the stop was at $66.93 (line 1) just below the June low of $67.14.
- The stop was then raised to $68.63, line 2, after it made a high at $73.32.
- A partial profit was taken early in the year.
NEXT PAGE: 2 More Portfolio Picks
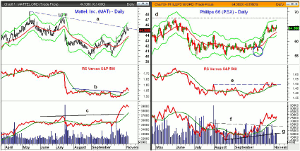
|pagebreak|Mattel, Inc. (MAT) was a retail pick from September and the daily downtrend, line a, was tested on Tuesday. The stock responded positively to its earnings in October as it reported a 20% revenue increase.
- The quarterly R1 resistance is at $46.47, along with the daily starc+ band, with the July high at $47.31.
- The weekly flag formation has a 127.2% Fibonacci retracement target at $50.80.
- The relative performance has just completed its base formation by moving through resistance at line b.
- The OBV shows an even stronger upside breakout as resistance (line c) was overcome on October 21.
- The weekly OBV is leading prices as it is already well above the highs made early in the year.
- There is initial support at $43.80 with the quarterly pivot at $43.25.
Phillips 66 (PSX) was a recommendation from last July and stayed in a trading range between $61.97 and $54.90 for the next three months. The drop in August came quite close to our stop at $54.19.
- PSX had one final drop in early October (see circle) before the recent surge to the upside as it recently hit $65.64.
- The rally was in reaction to a sharp drop in EPS from $2.51 a year ago to $0.81 in the latest quarter.
- The relative performance has just moved above the summer highs, line e, and is above its WMA.
- The weekly RS line (not shown) is above its WMA.
- The daily OBV confirmed the price action and continue to look quite strong as it is consolidating at its rising WMA.
- The daily chart has support at $62.70 and then at $62.19, which is the quarterly pivot.
What It Means: Although the Charts in Play portfolio has done quite well during this earnings season, it is not the time to be complacent. That is why I have raised some stops and recommended taking profits on stocks like Mattel, Inc. (MAT) if it came close to the next upside targets.
In hindsight, I should have taken some profits in Devon Energy (DVN) near the 38.2% resistance as the stop at $60.86 was hit Wednesday for a 5% profit.
The failure of Phillips 66 (PSX) to rally and drop in early October were the reasons I decided to reduce the exposure just before my two-week holiday. Half of the position was sold at $57.55 for a small profit.
I would recommend that you review your positions at least on a weekly basis, and if you get a 10% or greater profit in just a few weeks, take some profits.
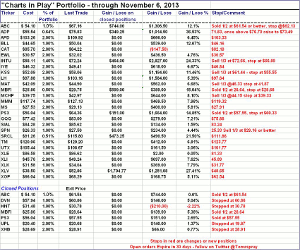
Be sure to review the table for the current positions and stops.
How to Profit: No new recommendation.
NEXT PAGE: The Charts in Play Portfolio
|pagebreak|Editor’s Note: If you’d like to learn more about technical analysis, attend Tom Aspray’s workshop at The Traders Expo Las Vegas, November 20-23, 2013. You can sign up here, it’s free.


