The lagging Dow Industrials tried to catch up with the S&P 500 last week and this month's analysis of the most oversold Dow stocks reveals some new opportunities in these high-yield, big cap stocks, says MoneyShow's Tom Aspray.
The relentless nature of the stock market's rally in 2013 has made several long-term bulls nervous about the near term outlook, even though they remain bullish long-term. The gains of the past two months have been contrary to the historical pattern which has many wondering about how stocks may do this month.
My analysis, as discussed in the Week Ahead column, suggests that November may be a choppy month, but the breakout in the weekly NYSE A/D line does indicate that stock prices will be higher by the end of the year. There are some early signs that investors are rotating to more defensive stocks, which makes this month's scan of overbought/oversold Dow stocks particularly interesting.
I use Starc band analysis to identify overbought and oversold conditions. When a market or equity is close to its upper monthly Starc band (Starc+), it is a high-risk time to buy and considered overbought. Conversely, when a stock is close to the lower monthly Starc band (Starc-), it is a lower risk time to buy and is considered oversold.
Once the list is obtained, I then look at the monthly, weekly, and daily analysis of each stock to find new opportunities. All of the most oversold Dow stocks have weak monthly relative performance patterns including International Business Machines Corp. (IBM) which is at the top of this month's most oversold list. It is just 10.2% above its monthly starc- band and is down over 6% this year.
The monthly OBV analysis of several oversold Dow stocks indicates that their long-term trend is still positive, and here are my favorites.
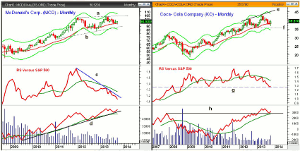
Chart Analysis: McDonald's Corp (MCD)
dropped slightly below the 20-month EMA in October, before closing higher and
forming a doji. Therefore a HCD
could be formed in November.
- The October low at $93.14 was just a few cents below the February low at
$93.19.
- The monthly chart shows an apparent flag
or continuation pattern, lines a and b.
- The quarterly pivot is at $97.32 with further resistance at $99.
- A completion of this formation, with a close above $104.30, has upside
targets in the $122-$124 area.
- The relative performance has been below its WMA since April 2012 and shows
a clear downtrend, line c.
- The weekly RS line (not shown) is still below its WMA but the daily is
positive.
- The monthly OBV turned up from its WMA in September and made a new
all-time high early in 2013.
- The weekly and daily OBV are positive so the multiple
time frame OBV analysis points higher.
- There is initial support now in the $95.50-$96.50 area, with further at
$94.68.
The monthly chart of Coca-Cola Company (KO) also shows a broad trading range, line e and f, as it hit a low of $36.83 in early October.
- This was a decline of 15% from the May high of $43.43.
- The monthly close was above the 20-month EMA and well above the quarterly
pivot at $38.94.
- There is next strong resistance in the $40.50-$41.50 area.
- The monthly starc+ band and trend line resistance, line e, is at $44.12.
- The monthly relative performance dropped below its WMA in August 2012.
- The weekly and daily RS lines show more signs of bottoming.
- The monthly OBV broke through major resistance at line h, in February
2013.
- The breakout level was tested in September before it turned higher.
- The daily and weekly OBV are both now positive.
- There is initial support now at $38.80, and then at $38.48, which is the
quarterly pivot.
- The projected monthly support is at $37.61.
NEXT PAGE: Two More Oversold Stocks to Watch
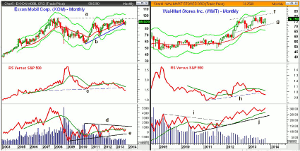
|pagebreak|Exxon Mobil Corp. (XOM) came very close to the long-term resistance from 2008, line a, at $96.12 in June.
- The October close at $89.62 was well above the 20-month EMA at $87.42,
which is now first support.
- The uptrend from the 2010 lows, line b, was tested but not broken on a
closing basis.
- The monthly relative performance has dropped below the long-term support
at line c, and is below its declining WMA.
- The weekly RS line is below its WMA, while the daily has just turned
positive.
- The monthly OBV has been in a tight range and is just barely below its
WMA.
- A move through long-term resistance at line d, would be very bullish.
- Initial support now at $87-88, with stronger at $85.95, which is projected
monthly support.
Wal-Mart Stores Inc. (WMT) also has been in a trading range, lines f and g, since October 2012. WMT had a low last month of $71.51, which was below the prior six month lows, but above the March 2012 low of $70.78.
- The monthly close was just barely above the September highs, triggering a
high close doji.
- This is bullish, as it suggests that the weak lows were stopped out at the
recent lows.
- The monthly relative performance has just recently broken its uptrend,
line h, and is well below its WMA.
- The weekly and daily RS analysis is trying to bottom out.
- The monthly OBV did make a new high in April 2013 and has held well above
its rising WMA.
- The daily OBV has moved above its WMA, but the daily has not.
- There is first good support at $74.93-$75.30, which corresponds to the
quarterly and monthly pivots.
What it Means: Despite the negative readings from the monthly relative performance analysis, the OBV analysis suggests that these four stocks have bottomed, or are in the process of bottoming.
Three are part of the consumer discretionary sector, which the monthly analysis indicates is one of the strongest sectors. As always the entry level is critical and would not chase any of these stocks.
How to Profit: For McDonald's Corp. (MCD), go 50% long at $96.46 and 50% at $95.58, with a stop at $92.83 (risk of approx. 3.3%).
For Coca-Cola Company (KO), go 50% long at $38.86 and 50% at $38.22, with a stop at $37.37 (risk of approx. 3%).
For Exxon Mobil Corp. (XOM), go 50% long at $87.48 and 50% at $86.54, with a stop at $84.38 (risk of approx. 3.1%).
For Wal-Mart Stores Inc. (WMT), go 50% long at $74.88 and 50% at $73.72, with a stop at $71.17 (risk of approx. 4.2%).
Editor's Note: If you'd like to learn more about technical analysis, attend Tom Aspray's workshop at The Trader's Expo Las Vegas, November 20-23. You can sign up here, it's free.


