Bullish momentum continues in the stock market despite uneasiness on the part of some market participants, so MoneyShow’s Tom Aspray counsels partial profit-taking, along with recommendations on where to invest those gains.
Stocks racked up another day of solid gains as most expect no change in policy from the FOMC this afternoon. This was in spite of weaker-than-expected retail sales and consumer confidence as it hit a six-month low.
The market internals were positive, and as noted yesterday, the weekly NYSE Advance/Decline line has broken out to the upside, which is positive for the intermediate term. The overseas markets are higher again in early trading as are the stock index futures.
It does appear that some are starting to chase some stocks and ETFs higher, which is a dangerous strategy. One should continue be patient and focus on the risk as we should see a pullback in the next week or so. In addition to the FOMC announcement, there are several other key reports on the economy out this week including the monthly jobs report.
The oil sector was discussed as a good portfolio bet in early October as the Select Sector SPDR Energy (XLE) typically forms a double bottom in October and November. While crude oil prices have continued to correct from the late August highs, many energy stocks and energy ETFs have been moving steadily higher. Though based on the daily studies they could see a pullback, the strong readings from the weekly studies indicates it will be a buying opportunity.
There are some energy stocks that are now just bottoming out, and as discussed below, traders could consider taking some partial profits at our next upside targets.
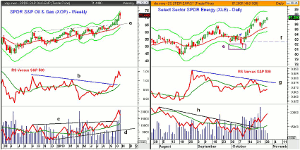
Chart Analysis: The SPDR Oil & Gas Exploration ETF (XOP) closed above weekly resistance, line a, on September 20 and tested the weekly starc+ bands over the past two weeks.
- The monthly starc+ band is at $73.76 with this week’s starc+ band at $74.61.
- The 127.2% Fibonacci target is at $75.11.
- The relative performance broke through its major downtrend, line b, at the end of September.
- This indicated that it was a market leading sector.
- The weekly on-balance volume (OBV) also staged a major upside breakout in September as resistance at line c was overcome.
- The gradual uptrend in the OBV indicating accumulation and the rising WMA was tested in August.
- From the early October high at $68.79, XOP dropped back to test the quarterly pivot at $64.95.
- There is first good support now in the $68.50-$70 area.
The Select Sector SPDR Energy (XLE) and iShares DJ Energy Index (IYE) are both less diversified than the XOP but are also acting well.
- The drop in early October took XLE into the 38.2-50% support zone (line e) that was calculated from the June lows.
- XLE closed for two days below the quarterly pivot at $82.51 (line f) but did not close below it on a weekly basis.
- The quarterly R1 resistance at $86.67 has been exceeded with the weekly starc+ band at $89.57.
- The daily relative performance has formed lower highs, line g, and is back below its WMA.
- The daily OBV tells a much different picture as the several-month downtrend, line h, was broken in the middle of the month.
- The weekly OBV (not shown) looks much stronger as it is well above the 2012 highs.
- The daily chart has first support at $85-$85.50 and then further at $84.
NEXT PAGE: 2 Bottoming Energy Picks
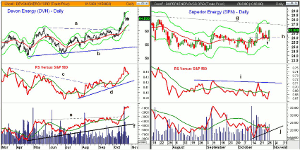
|pagebreak|Devon Energy (DVN) broke out to the upside on October 11 as it closed above the resistance at line a, in the $60.30 area.
- The daily starc+ band was exceeded last week as the quarterly R3 resistance at $66.68 was overcome.
- The monthly starc+ band is at $70.57 with resistance from 2012 at $69-$71.
- This also corresponds to the upside target from the daily flag formation (lines a and b).
- The relative performance broke its downtrend, line c, in August and it was retested in early October.
- The RS line continues to rise strongly and is well above its WMA and support at line d.
- The daily OBV has been acting stronger than prices since April.
- The OBV resistance at line e was overcome in October.
- The weekly studies (not shown) also are clearly positive.
Superior Energy (SPN) rallied up to the daily starc+ band on October 18, reaching a high of $27.60 before pulling back.
- SPN formed a doji on Monday and a high close doji was triggered on Tuesday as it closed back above the quarterly pivot at $26.05 (line h).
- Once above the next resistance at $27.60, the quarterly R1 is at $27.78 with the monthly downtrend at $33.06.
- The daily relative performance has moved back above its WMA with stronger resistance at line i.
- The daily OBV is barely above its WMA as it has formed higher lows, line j.
- The weekly OBV (not shown) is leading prices higher as it has moved above the 2012 highs.
- There is minor support now at $26-26.20 with further at $25.50.
What it Means: Given the sharp gains this month in the ETFs, they are vulnerable to a pullback as SPDR Oil & Gas Exploration ETF (XOP) is up over 10% from the lows just 14 days ago. This type of quick gain makes some profit taking a reasonable choice, even though they should be much higher in the next few months.
There are still quite a few stocks like Superior Energy (SPN), which are just bottoming out and profits could be put into stocks like it. I will continue to look for more in the weeks ahead.
How to Profit: For Superior Energy (SPN), go 50% long at $26.33 and 50% long at $25.94, with a stop at $24.73 (risk of 5.3%).
Portfolio Update: For SPDR Oil & Gas Exploration ETF (XOP), should be 50% long at $66.04, with a stop now at $67.67.
For iShares DJ Energy Index (IYE), should be long at $46.32 with a stop at $46.58. Sell ½ at $50.44 or better.
For Select Sector SPDR Energy (XLE), should be 50% long at $82.84 with a stop at $81.33. Sell ½ at $90.89 or better.
For Devon Energy (DVN), should be 50% long at $57.94, with a stop at $59.58. Sell ½ at $69.26 or better.
For Ultra Petroleum Corp (UPL), the 50% long at $20.52 and 50% at $20.28 were stopped out at $19.87.


