As the data backlog resulting from the government shutdown start being released again, MoneyShow’s Tom Aspray takes a technical look at which sectors are likely to produce winners.
The third consecutive week of solid stock market gains has made investors less fearsome over this week’s FOMC meeting. The government shutdown and resulting delay in economic data releases has made any significant change in Fed policy less likely this week.
The new highs in the S&P 500 and the fact that the S&P has gone 529 trading days without a 10% correction has reduced much of the fear that was evident at October’s early drop. But many individual investors are still on the sidelines. The Nasdaq 100 is up 5.1%, so far, this month with the S&P 500 a close second at 4.8%. Both continue to outperform the Dow Industrials, which was up just 2.9%.
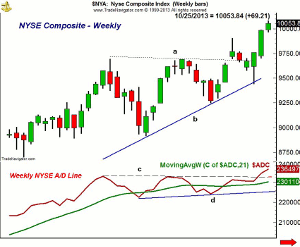
Just two weeks ago, as I was preparing to take a break, the main concern from a technical standpoint was the fact that the weekly NYSE Advance/Decline line was still within its broad trading range. It had failed to confirm the new market highs and was lagging the price action.
The weekly chart shows that the NYSE Composite completed its trading range in September as resistance at line a was overcome. The NYSE then pulled back to test its uptrend, line b, in early October before the recent strong surge as it made new highs for the year. The NYSE is still below the all-time highs from 2007 at 10,387.
On Friday October 18, the weekly NYSE A/D line closed above the highs from April and July, line a. This reaffirmed the positive major trend and the A/D line did hold above its WMA during the October drop. The completion of the trading range, lines c and d, with the new all-time highs continues to favor buying stocks on the pullbacks.
In addition to the FOMC meeting, there are many key economic reports this week, starting today with the Producer Price Index, Retail Sales, S&P Case-Shiller Housing Price Index, and the Conference Board’s Consumer Confidence Index. Therefore, corrections are likely in reaction to the economic data or to earnings reports but which market segments should you be watching for new purchases?
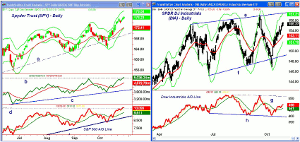
Chart Analysis: The Spyder Trust (SPY) has had an impressive rally from the October 10 low at $164.53 as the starc- band was tested.
- Last week, the daily starc+ band was approached and it is now at $178.58.
- The close Monday was above the quarterly R1 resistance at $175.22 with the R2 at $186.98.
- The on-balance volume (OBV) has now moved above the prior highs, line b, which confirms the price action.
- The OBV held support at line c on the correction and moved above its WMA two days after the October lows.
- The S&P 500 A/D line also moved back above its WMA soon after the October lows.
- The A/D line has also made new highs.
- There is minor support now at $173.50-$174 with the rising 20-day EMA at $172.41.
The SPDR DJ Industrials (DIA) dropped below the late August lows in October and support at line f, as the quarterly S1 support at $146.97 was tested.
- DIA is now back above the quarterly pivot at $152.02 with the 20-day EMA at $153.11.
- The Dow Industrials A/D line is slightly above its WMA but does show a pattern of lower lows, line h.
- The A/D line is still well below the previous highs at line g.
- The OBV (not shown) is above its WMA but is still in a downtrend while the relative performance still indicates that DIA is weaker than the S&P 500.
- It is still below the September 18 high at $157.06 with the daily starc+ band and the upper trend line at $157.31-$157.50.
NEXT PAGE 2 Surging ETFs
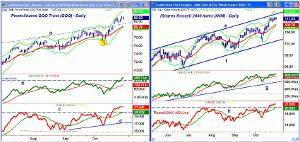
|pagebreak|The Powershares QQQ Trust (QQQ) is up 8.6% from the October 9 low at $76.35 as the quarterly pivot at $76.92 was violated intra-day but QQQ did not close below it.
- The daily starc- band (see circle) was also exceeded indicating it was a low risk level to buy.
- The gap above the resistance at $80.88,line a, confirmed that the QQQ was still a market leader.
- The quarterly R1 resistance at $82.48 has now been overcome with the daily starc+ band at $84.46.
- The daily OBV has confirmed the new price highs and it is well above its rising WMA.
- The Nasdaq 100 A/D line has moved well above the strong resistance at line c.
- This was noted as a clear possibility in the last Week Ahead column.
- The A/D line is well above its rising WMA.
- There is first support at $80.76 to $81.55, which includes the rising 20-day EMA. There is further support in the $78 area.
The iShares Russell 200 Index (IWM) has made new highs at $111.49 in the past week as the quarterly R1 resistance at $111.37 was exceeded.
- The upper boundary of the trading channel, line e, is at $112.49 with the daily starc+ band at $113.53.
- The daily OBV has made marginal new highs and it is above its WMA.
- The weekly OBV (not shown) is still clearly positive so the multiple OBV analysis is bullish.
- The Russell 2000 A/D line has also moved well above the three-month resistance at line h and has confirmed the price action.
- The A/D line is well above its rising WMA.
- The weekly relative performance (not shown) continues to indicate that it is a market-leading sector.
- There is first good support in the $108-$110 area and then at $106.
- The quarterly pivot stands at $104.41.
What it Means: The turmoil in Washington caused many to sell in early October as some investors sold in a panic. As I recommended on October 11, Avoid the Noise, Watch the Numbers, investors and traders should make their decisions based on the numbers, not on emotion.
The quarterly pivot table should still be used as a valuable guideline, and with some of the major ETFs now reaching their R1 resistance levels, we could see some profit taking. This should be a buying opportunity in the small-cap technology stocks.
How to Profit: No new recommendation
Portfolio Update: For the PowerShares QQQ Trust (QQQ), should be 50% long at $77.42 and 50% long at $76.64, with stop now at $75.89.


