This is a big week for top technology companies reporting quarterly earnings and MoneyShow's Tom Aspray examines the charts in search of some candidates to buy on pullback.
The moderately lower close Monday has weakened the short-term outlook as 1,539 stocks were up with 2,466 down. This has caused most of the volume and market internals indicators, like the McClellan oscillator, to turn lower.
The market is now waiting for the testimony of Ben Bernanke, which could be a good excuse for traders to take profits, but the futures are higher in early trading. I'm sticking with Monday's view that it was not the time to buy the market.
Some industry groups, like the regional banks, peaked six-seven days ago and some are already getting close to first good support. The extent of the correction in some of the key sectors and industry groups will help isolate the new market leaders.
The volume action in the technology sector favors buying a pullback and several of the previous tech recommendations have done well. One small-cap tech stock should also be considered as it appears to have completed a year long bottom formation.
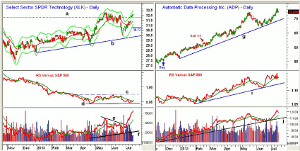
Chart Analysis: The Select Sector SPDR Technology ETF (XLK) peaked at $32.41 in May and then dropped to a low of $30.20 in June.
- The gap higher last week has taken XLK back above the September high of $31.74.
- Support is at $31.50 with the 20-day EMA at $31.38 and the quarterly pivot level at $30.72.
- The relative performance has moved back above its WMA as
it has bounced from support at line d.
- The RS line has key resistance at line c.
- The weekly RS analysis also shows a potential weekly
bottom formation.
- The daily OBV broke its downtrend, line e, in early
July and has good support at line f.
- The next upside targets are at $32.88.
Automatic Data Processing Inc. (ADP) has had a stellar run, so far in 2013, as it is up 28.3%. Last week the May high at $72 was overcome.
- The monthly starc+ band at $74.90 is the next likely
upside target.
- The relative performance did confirm last week's high
and is still holding above its WMA. The longer-term support is at line i.
- The weekly RS line also did confirm the recent highs.
- The daily OBV tested its long-term uptrend, line j, on
the recent correction.
- The OBV also made new highs last week as did the weekly OBV (not shown).
- There is initial support at $71.20 to $70.50.
- The quarterly pivot at $68.25 now represents major
support.
NEXT PAGE: 2 Tech Stocks to Buy on Pullback
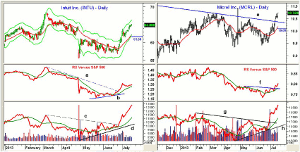
|pagebreak|Intuit Inc. (INTU) was recommended a week before the June lows and is now challenging the mid-April highs at $65.30.
- The daily starc+ band
is at $66.30 with further
resistance at $68.41, which was the March high.
- The relative performance broke its downtrend, line a,
on June 24 after forming higher lows, line b.
- At the same time, the daily OBV broke through its four
month resistance, line c, confirming the positive divergence (line d).
- The weekly OBV and RS analysis are also positive.
- There is initial support now at $62.20-$63 with the quarterly pivot at $61.60.
- A doji was formed Tuesday suggesting the uptrend may
be ready for a pause.
Micrel Inc. (MCRL) is a $625 million analog integrated circuit company that reports earnings on July 25.
- The daily downtrend, line e, was overcome last week
with the next major resistance from 2012 at $11.17.
- A close above this level would complete a $2 trading
range that goes back to the middle of 2011.
- The minimum upside targets are in the $13-$13.50 area.
- The relative performance completed its bottom last
week when it moved through resistance at line f.
- The OBV has been very strong as it broke through
resistance at line g in June.
- The OBV shows a strong uptrend, line h, and is well
above its WMA.
- The breakout level (line e) is now at $10.36 with the
quarterly pivot at $10.08.
What it Means: In the recent sector report (Red-Hot Summer Sectors), the technology sector was identified as a sector that could lead the market higher going into the end of the year, if not longer, but the weekly RS analysis needs to complete its bottom formation first.
One way to participate is to buy the Select Sector SPDR Technology ETF (XLK), and I also have again recommended the PowerShares QQQ Trust (QQQ), which also gives exposure to the biotechnology sector.
How to Profit: For the Select Sector SPDR Technology ETF (XLK), go 50% long at $31.58 and 50% long at $31.04, with a stop at $29.83 (risk of approx. 4.8%).
For Micrel Inc. (MCRL), go 50% long at $10.38 and 50% long at $10.12, with a stop at $9.76 (risk of approx. 4.8%).
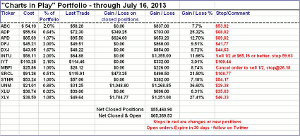
Portfolio Update: Should be 50% long Intuit Inc. (INTU) at $58.43 and 50% long at $57.78. Sell 1/3 of the position at $65.16 or on a stop at $64.64. Then use a stop on the remaining position at $59.63.
Still long Automatic Data Processing (ADP) from $55.54 with a stop at $68.62. I recommended selling half the position at $61.42 in February.
Since the market has rallied so sharply since late June, cancel any open recommendation made prior to July 1.
NEXT PAGE: The Charts in Play Portfolio
|pagebreak|


