Better-than-expected US economic data continues to fuel the stock market, even as mixed messages from the Fed dials it back, and MoneyShow’s Tom Aspray, identifies four attractive buy candidates.
The selling in the last few minutes of the quarter erased some of last week’s gains but those late losses have been erased by the early strength in the stock index futures. This week’s trading is likely to be quite volatile for a number of reasons.
In addition to the holiday-shortened week and the heavy economic calendar, we have the monthly jobs report on Friday, July 5, when the trading has been historically thin. The technical evidence as discussed in Friday’s Week Ahead column does allow for the completion of a short-term market bottom this week.
Any further correction this week will need to be shallow and the breakout of the A/D lines will need to be confirmed. The decline from the May highs has relieved the overbought status of many of the technical studies as over 85% of the S&P 500 stocks were above their 50-day MAs in May but that number dropped to a low of 26 last week.
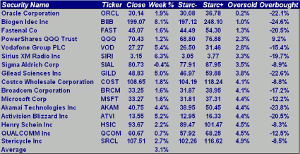
Last Monday, I featured the weekly starc- band scan of the Nasdaq 100 stocks that were the closest to their starc- bands. These stocks had a good week as Biogen Idec Inc. (BIIB) was the best performer gaining 8.3% and only one stock was lower. The average gain for the week of the 15 stocks was 3.1% (see Table 2).
The regular monthly scan isolates those Dow stocks that are closest to their starc+ bands (overbought) and those that are closest to the starc- bands (oversold). Of course, those stocks that are classified as oversold can still go lower but are closest to their projected lows. The completion of the bottom formation in bond yields in late May pressured some of the high-yield stocks so I have also included the current yield for each stock.
Once the list is obtained, I then look at the monthly, weekly, and daily analysis of each stock to find new opportunities. For example, at the top of this month’s most oversold list is International Business Machines Corp. (IBM), which is 9.03% above its monthly starc- band. The multiple time frame analysis of IBM suggests that it can still move lower.
Let’s look at which Dow stocks look attractive in July, which is generally a positive month for stocks.
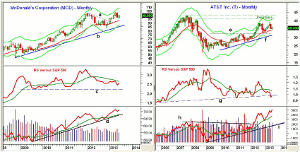
Chart Analysis: McDonald’s Corporation (MCD) peaked in April at $103.70 and hit a low of $95.16, which was a drop of 8.2%. The quarterly pivot is now at $99.29.
- The 50% Fibonacci retracement support from the November lows is $93.47 with the rising 20-month EMA at $92.68.
- The monthly relative performance confirmed the 2012 highs and turned up last month though it is still below its WMA.
- The monthly OBV has been stronger than prices and is very close to making new all-time highs.
- The OBV is well above its uptrend (line d) and its WMA.
- The weekly OBV just closed above its WMA so the multiple time frame OBV analysis points higher.
- Initial resistance at June’s high of $100.
AT&T Corporation (T) peaked at $39 in April when it was yielding 4.6%. It had a June low of $34.10 and currently yields 5.1%, which is the highest of last month’s oversold stocks.
- The rising 20-month EMA has been tested and the 38.2% support at $34.49 from the 2011 lows was broken.
- The 50% Fibonacci support is at $33.11 with monthly support at $32.17.
- The relative performance has turned up after breaking support.
- The RS line is below its WMA as is the weekly RS line.
- The monthly OBV broke out to the upside in early 2012 (line h) and closed at a new high in June.
- The weekly OBV shows a pattern of higher highs and is above its WMA.
- Initial resistance at $36.28-$36.39, which includes the quarterly pivot.
NEXT PAGE: 2 Stocks on Tom’s Watch List
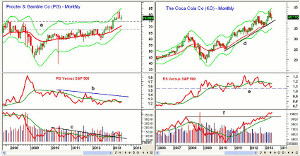
|pagebreak|Procter & Gamble Co. (PG) has formed dojis over the past three months with the long tails representing key resistance in the $82.35-$82.54 area as the monthly starc+ band was tested in April.
- The monthly chart shows a band of support, line a, between $74.10 and $69.10, lines a.
- The rising 20-month EMA is now at $70.56.
- The monthly relative performance has turned up but is below its flat WMA.
- The weekly RS line is below its WMA.
- The OBV may have completed its bottom because after breaking its downtrend, line c, it has turned up from its WMA.
- The weekly OBV is also above its WMA.
The Coca Cola Co. (KO) tested is monthly starc+ bands in April-May as it made a high of $43.43.
- The recent low was at $38.97 with 61.8% Fibonacci support from the early 2013 low at $38.59.
- The monthly uptrend, line d, is at $38.23 along with the rising 20-month EMA at $37.86.
- The relative performance is below its WMA but is holding above support at line e.
- The monthly OBV overcame resistance from 2007, line f, in February.
- The weekly OBV has turned up but is still below its WMA.
- There is first resistance at $40.88 with stronger at $41.44.
What it Means: All four of these stocks are likely to be higher by the end of the year but all could retest the recent lows before a bottom is in place. My two favorites right now are McDonald’s Corporation (MCD) and AT&T Corporation (T), but I will be watching the other two closely over the next few weeks.
How to Profit: For McDonald’s Corporation (MCD), go 50% long at $98.26 and 50% long at $95.44, with a stop at $92.46 (risk of approx. 4.5%).
For AT&T Corporation (T), go 50% long at $34.86 and 50% long at $34.16, with a stop at $32.77 (risk of approx. 5%).


