Much of the market’s recent strength came from the resurgence of cyclical stocks over defensive stocks with utilities selling off, which prompted MoneyShow’s Tom Aspray to go bargain hunting in this beaten-down sector.
The ability of the market to absorb the fairly heavy selling after weak openings on Thursday and Friday was a positive sign for the market that must make those on the short side of the market nervous. The stock index futures are showing strong gains in early trading.
As I reviewed in last Friday’s Week Ahead column, there is plenty of economic data out this week starting with the S&P Case-Shiller HPI before the opening, followed by Consumer Sentiment.
One sector that has been hit very hard in the past four weeks is the utility sector as the Select Sector SPDR Utilities (XLU) is down 6.3% from its high while the Spyder Trust (SPY) is down just 2.2% from its highs. This selling in one of the traditional safest sectors could be a reaction to the increasing bullishness of individual investors as they move to more speculative issues. Alternatively, it could be a sign of concern over some of the utilities’ high debt levels that could make them more vulnerable if rates do move higher.
A technical look at the widely followed utility ETF, as well as three utility stocks, suggests that they can still drop further over the next month or so. All three of these utility stocks have current ratios over 1.5. It is the ratio of current assets to current liabilities and provides a good measure of a company’s ability to pay its dividends over the next 12 months.
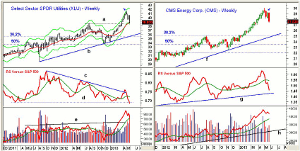
Chart Analysis: The chart of the Select Sector SPDR Utilities (XLU) yields 3.7%. It tested its weekly starc + band every week in April and last week’s 4% drop took it back to the weekly starc- band.
- The 20-week EMA has also been tested, as well as the support from the early 2012 highs, line a. The quarterly pivot is at $37.75.
- The 38.2% retracement support from the 2011 lows and the uptrend, line b, are both in the $35.50-$36 area.
- The relative performance has been diverging from prices since late 2011, line c, as it just barely broke its downtrend at the April highs.
- The RS line has just violated support suggesting it is still lagging the S&P 500.
- The OBV has been much stronger as it moved well above the 2011 and 2012 highs early this year.
- The weekly OBV has good support at line e, and the monthly OBV also confirmed this year’s highs.
- Initial resistance now at $39.80-$40.40.
CMS Energy Corp. (CMS) is a $7.32 billion utility, which operates primarily in Michigan and currently yields 3.7%. It has a current ratio of 1.54.
- CMS triggered an LCD three weeks ago (see arrow) and is down 8.2% from its high at $29.98.
- The quarterly pivot is at $26.78 with the 38.2% Fibonacci support at $25.
- The 50% support is at $23.43. Typically, high probability entry levels come between the 38.2% and 50% support level.
- The relative performance did make new highs before reversing sharply and dropping back below its WMA.
- The weekly OBV did confirm the price highs, and though it is declining, it is still well above its WMA and the support at line h.
- There is resistance now in the $28.80 to $29.50 area.
NEXT PAGE: 2 More Stocks to Watch
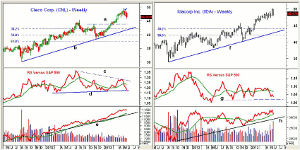
|pagebreak|Cleco Corp. (CNL) is a $2.80 billion electric utility that operates in Louisiana and Mississippi and currently yields 3.13%. It has a current ratio of 1.68.
- CNL spiked to a high of $49.03 in early May and formed a doji. The following week an LCD was triggered.
- The 2012 high at $45.30 is not far below current levels with the 38.2% retracement support at $42.11.
- The 50% Fibonacci retracement support stands at $39.79.
- The relative performance failed to make new highs with prices, line c, and is now testing support, line d.
- The OBV is still holding up very well as it is trading near its recent highs.
- The OBV is well above its WMA and the support at line d.
- There is resistance for CNL at $48.80-$49.40.
Idacorp, Inc. (IDA) is a $2.43 billion utility that has a current dividend of $1.52 and a yield of 3.10%. It has a current ratio of 1.50.
- IDA is holding close to its recent highs at $50.16 with the quarterly R1 resistance at $49.96. The R2 level is at $51.95.
- The relative performance has been diverging from prices and is well below its WMA.
- There is next support for the RS line at line f.
- The weekly OBV did make marginal new highs this month though volume was high last week.
- Good support for the OBV is at line g.
- There is first good support for IDA at $45.67 with stronger at $43.50-$44 (line e).
What it Means: As I pointed out in Eyes On Income, the current trend for yields is higher as short- and long-term rates are trying to complete weekly bottom formations.
The current outlook suggests that the utilities could drop another 5-8% over the next month or so. I think this will be a good buying opportunity, especially for the income investor.
For example, if CMS Energy Corp. (CMS) drops to $24.25, its yield would rise to 4.2% from 3.70% currently. I now only have a recommendation in the Select Sector SPDR Utilities (XLU), but will be watching the key levels of support for the others.
How to Profit: For Select Sector SPDR Utilities (XLU), go 50% long at $37.14 and 50% at $36.34, with a stop at $34.91 (risk of 5%).


