In the battle between the rampant bullishness of stock fund managers and high skepticism of many traders, the bulls are still wining. But some are now looking at one out-of-favor market for bargains, but technically that looks like a bad idea, says MoneyShow's Tom Aspray.
The Spyder Trust (SPY), as well as the Dow Industrials, broke their five-day winning streak on Thursday and the futures are a bit lower early Friday. No real US economic data today for the market to react to but Asian markets were strong on the back of the higher dollar and weaker yen.
A further correction in the stock market is possible at any time but it would take a weekly close below the prior week's lows to signal a more significant market turn. However, there is one market that has rebounded sharply over the past few weeks, tempting some to buy. A look at the technical studies suggests that it is ready for another wave of selling.
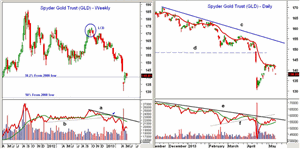
Chart Analysis: The weekly chart of the Spyder Gold Trust (GLD) shows that a LCD sell signal was triggered the week ending October 12, 2012, when it closed at $170.06.
- The uptrend in the weekly OBV, line b, was broken in December as the volume spiked.
- As the selling picked up in April, Fibonacci support as it hit a low of $130.50.
- The major 50% support from the 2008 lows is at $126.
- GLD has rebounded over the past three weeks to fill the gap as it hit a high of $143.43.
- There is much stronger resistance now in the $148-$150 area.
- The OBV rallied back to its declining WMA (see arrow) in early February and shows a clear pattern of lower lows.
- The on-balance volume (OBV) has major resistance at its WMA and the downtrend, line a.
The daily chart more clearly shows the recent rebound and the sideways pattern that has formed over the past 11 days. Gold futures are lower in early trading so this range will likely be broken today.
- It is a negative sign that prices have just been testing the flattening 20-day EMA but have not been able to decisively close below it.
- The daily chart shows that there is another gap in the $148.85 (line d) to the $150.65 area.
- The daily downtrend, line c, is now in the $154 area.
- The daily OBV has just rallied back to its long-term
downtrend, line e, which is also negative and consistent with a failing rally.
- The OBV has failed to make it back to the former support, now resistance at line f.
- There is minor support now in the $139 area, which is likely to be broken today.
NEXT PAGE: When Will Gold Miners Bottom?
|pagebreak|In last month's article, The Most Oversold Gold Miners, I took a look at the oversold status of gold mining stocks as several had closed below their starc- band. The technical outlook then suggested that while some analysts were turning bullish, oversold rallies were expected to fail.
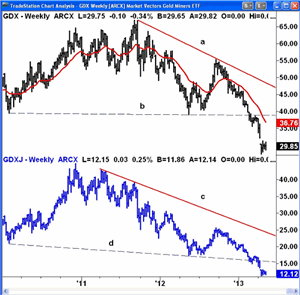
Many have rallied 20% from the lows, and the weekly chart of the Market Vectors Gold Miners ETF (GDX) shows that it has just been moving sideways for the past four weeks.
- Everyone who bought since early 2010 was holding a losing position after the support at $38.80 (line a) was broken in February.
- GDX has not yet filled its gap from April.
- A drop back below the daily support at $28 will reaffirm the downtrend.
- The monthly pivot is now at $31.84 and the failure of GDX to move above it on the recent rally is a sign of weakness.
The chart of the Market Vectors Junior Gold Miners ETF (GDXJ) looks even weaker as it has formed a clear pattern of lower lows, line d.
- GDXJ is already close to its recent lows at $11.28 and the daily OBV (not shown) has been back below its WMA since early May.
- The monthly pivot is at $13.61 with stronger resistance now in the $15.50-$16 area.
- The long-term downtrend is in the $17.80 area.
What it Means: Gold and the gold miners were weak enough before the US dollar started to gain strength. It will take much more time from a technical perspective before a sustainable bottom can be formed in gold or the miners. Typically, gold does form a seasonal low in late July.
How to Profit: No new recommendation
Portfolio Correction: Yesterday's portfolio page did not reflect that our long position in Murphy Oil Corp. (MUR) was stopped out at $59.19.
I will be out next week and the next Charts in Play column will be released on May 20.


