The MACD has become a popular technical indicator in recent years, but there is a lot of misinformation about it, so MoneyShow's Tom Aspray explains how it should be used to produce valid signals.
As the stock market continues to grind higher, the market is going to be bombarded by potentially market moving news for the rest of the week. This includes this afternoon's FOMC announcement, as well as the ECB and jobs report on Friday.
The market internals were clearly positive again on Tuesday as they have been pointing higher since late last year. In strongly trending markets, the use of price momentum indicators is more difficult as too many look only at the daily analysis.
Still, I was surprised when in early April one analyst decided to reduce their equity exposure ahead of the sell in May because of a sell signal from the daily MACD. This was a clear sign that he may have not done enough work studying the MACD, which was developed by Gerald Appel in 1979.
I first started using the MACD in 1982 and even Gerald Appel was a bit surprised a couple of years later when I thanked him for his great idea. The key is that one needs to look at it on multiple time frames, especially the weekly, in order for it to be effective. It is still one of the best tools for markets where you can't use volume or A/D data.
In a previous trading lesson, Demystifying the MACD, I explained how I have found that looking at the MACD in histogram form can be more revealing. Let's look at what the MACD-His and other indicators are currently telling us about the Spyder Trust (SPY).
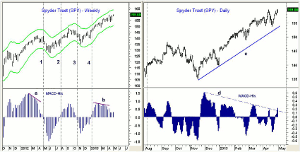
Chart Analysis: The weekly chart of the Spyder Trust (SPY) covers the period from late 2011 until the present.
- The weekly MACD-His barely crossed above the zero line
the week ending October 22, 2011, which was not long after the market low on
October 4.
- The MACD-His rose steadily until February and then
formed a negative divergence in early April, line a.
- In the first week of May, the MACD-His dropped below
the zero line (line 1).
- The MACD-His stayed below the zero line until early
August, well after the June lows (line 2)
- There were no divergences at the September highs as
the MACD-His crossed back below the zero level (line 3) at the end of October.
- By the first week of the New Year (line 4), the
MACD-His was back above the zero line.
- The weekly MACD-His has been diverging from prices
since the latter part of March, line b, indicting a loss of upside
momentum.
The daily chart of the Spyder Trust (SPY) shows a much different picture, and at first glance, one can see that sometimes it is a good tool for traders, but it is not a good investing tool.
- The daily MACD-His peaked in late June of 2012 (not
shown) and it formed lower highs in August and September.
- It dropped below zero in August and then below zero on
September 25, six days after the high.
- The daily MACD-His turned positive four days after the
November 15 lows and turned negative near the December lows.
- In 2013, it has moved through the zero line seven
times with the most recent positive signal on April 25.
- The daily MACD-His has just moved above its long-term
downtrend, line d, but still shows a pattern of lower highs.
- The daily chart has short-term support now at $157.65, which is May's monthly pivot, with the monthly S1 support at
$155.58.
NEXT PAGE: Look at Weekly, Not Just Daily MACD
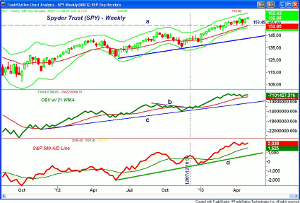
|pagebreak|The weekly chart of the Spyder Trust (SPY) includes just two days of data for this week with the weekly starc+ band at $163.43.
- It also reveals the key support, line a, at $153.45
and the 20-week EMA at $152.85.
- The weekly on-balance volume (OBV) broke through its downtrend,
line b, on December 7.
- This was one of the reasons I was confident we would see double digit gains in 2013.
- The OBV is still holding above its WMA but has not yet
confirmed the recent highs.
- The daily OBV (not shown) has confirmed the new highs
as it staged an upside breakout last Thursday.
- The weekly NYSE Advance/Decline moved through its WMA in January
but the daily (not shown) broke out to new highs in the first half of
December.
- The weekly A/D is well above its WMA and the long-term
uptrend, line d.
What it Means: The key point is that if you are an investor using the MACD or Welles Wilder's RSI, be sure to look at the weekly analysis and don't act based just on the daily studies.
Intra-day traders can use the hourly with the daily, taking only signals where both time periods are in agreement.
So far, there are no sell signals from the OBV or A/D line, but there are signs that upside momentum has slowed.
How to Profit: In the last Week Ahead column, I advised that those who were 100% long should sell 20%. Based on the SPY, that would have meant you sold 20% on the opening Monday April 29 at $158.67. Also, I said "Sell another 20% on a move in the S&P 500 above 1,615." I would sell a further 20% on a daily close in the S&P 500 below 1,535.


