Gold’s 9.3% nosedive last week marked the largest one-day drop in New York since 1980, and with investor sentiment running at extremely pessimistic levels, MoneyShow’s Tom Aspray takes a technical look at this sector in search of bargains.
The optimistic close Friday in the US equity markets has spread to the overseas markets with the Nikkei 225 up 1.9%. The Euro markets are also higher with Spain showing the best gains but even the German DAX is up over 1%. Last week’s analysis of the DAX revealed that it briefly violated key support and bears close watching.
The gold futures are also up sharply in early trading, up over $37 or 2.6%. The precipitous drop in gold and the gold-based ETFs took many long-term holders out of this market, and they are unlikely to trust this market for some time.
The drop in gold further pressured the already weak gold mining stocks. From the early 2012 highs, the Market Vectors Gold Miners ETF (GDX) is down over 50% vs. a 22% drop in the Spyder Gold Trust (GLD).
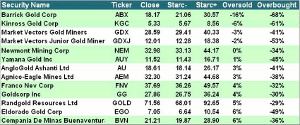
Some are now wondering whether certain gold mining stocks have reached bargain levels and may be attractive for new purchases. Therefore, I wanted to run a weekly Starc - band analysis scan on the largest gold miners and two widely followed gold mining ETFs.
Leading the list as the most oversold is Barrick Gold Corp. (ABX) as it is 16% below its weekly starc band. In fact, the top four on the list all closed last Friday below their weekly starc- bands. This is an indication that they are in a high-risk sell area but that does not mean they should be bought.
Given the early action in the gold futures, they are all likely to see healthy rebounds or at least some stabilization in the coming weeks. But are there any signs that they have bottomed?
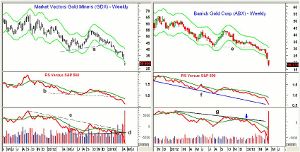
Chart Analysis: The Market Vectors Gold Miners (GDX) is a $7.44 billion dollar ETF with Barrick Gold Corp. (ABX), Goldcorp, Inc. (GG), and Newmont Mining Corp. (NEM) as the three largest holdings.
- The weekly chart shows its high in 2011 at $66.98 and it is down 57% from the highs.
- The rebound in 2012 tested the weekly starc+ band last September before resuming its downtrend.
- The support, line a, was decisively broken at the end of January.
- GDX is now testing its quarterly S2 support at $28.59.
- The relative performance has been below its WMA since last November and broke further support, line b, about nine weeks ago.
- The weekly OBV shows a well-established downtrend, line c, that goes back to September 2011.
- The OBV broke further support, line d, in late March.
- Volume in April is the highest ever.
- The monthly lows from 2008 are in the $15.83-21.27 area.
Barrick Gold Corp. (ABX) is an $18.2 billion gold miner with interests in North America, South Africa, and Australia. It currently yields 4.4% but at the end of 2012 only yielded 2.2%.
- ABX is also currently trading well below the monthly starc- band for April at $21.85.
- The all-time low from 2008 was $17.27, which is not far below last week’s low at $17.51.
- There is support from 2002-2003 in the $13.46 to $14.10 area.
- The pattern of lower lows in the relative performance, line f, reflects that it has been much weaker than the S&P 500.
- The weekly rebounded last fall before dropping back below its WMA last December.
- The OBV rebounded to test its WMA in early January (see arrow), which was a classic OBV sell signal.
- There is first resistance in the $20.76 to $22.58 area.
NEXT PAGE: Should You Buy, Sell, or Wait?
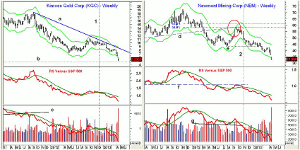
|pagebreak|Kinross Gold Corp. (KGC) is a $6.08 billion global gold company that currently yields 3%. It is second on the most oversold list as it closed last week 6% below its starc- band.
- There is support from 2005 at $4.91 with the quarterly S3 support at $4.36.
- The relative performance and OBV turned negative the week ending December 8 as the RS line dropped below its WMA.
- The RS line has continued to make new lows.
- The OBV broke two-year support, line d, in May 2011 and stayed below its WMA for almost a year.
- The sign that the fall rebound was over was when the OBV dropped back below its WMA (line 1) in December.
- There is initial resistance in the $5.80 area with stronger at $6.27.
Newmont Mining Corp. (NEM) is a $16.4 billion gold and copper mining company that peaked in 2011 at $70.42. It is now down 53% from its high.
- The monthly starc- band is at $31.58 with next support from 2008 at $26.80.
- The rebound in NEM from the July lows failed at the 50% Fibonacci retracement resistance and former support, now resistance at line d.
- The weekly studies broke support (line 2) in early November of 2012.
- The rally in the relative performance was weak as it failed to move above the resistance at line f.
- The OBV also dropped below its support at line g and was leading prices lower.
- It has made further new lows last week and has tested its declining WMA twice in 2013.
- There is initial resistance at $33.53 and then stronger at $36.53.
What it Means: In a weekly Barron’s article, A Vein of Hope for Gold Miners, the author points out that the gold miners are one of the most hated sectors and that “Newmont and Goldcorp could rise 40%.”
Though they may be right, it is likely to be a rebound within a downtrend. In my experience, it takes a market quite a while to recover from a decline like what has occurred in the gold miners. Those who did not sell already will be looking to sell on a rally.
How to Profit: No new recommendation


