Renewed worry about slowing economic growth has fueled bond prices, sending yields down to a four-month low, and MoneyShow's Tom Aspray examines the charts for what the implications are for the stock market rally.
The rebound Tuesday was quite impressive as the gains were strong and the market internals reflected good buying. Was this enough to signal that Monday's plunge was just a sharp pullback designed to shake out the weak longs?
In my analysis, it is too early to tell and the futures are sharply lower in early Wednesday's trading. The key will be the action over the next two days as two higher closes and at least one very strong up day are needed reverse the deterioration I noted last week.
If instead, prices reverse to the downside, either today or tomorrow, and the selling pressure is significant, it will favor a more significant decline. It appears that this may be the view of the bond pros.
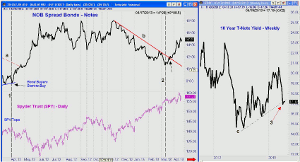
As I discussed last spring, when the Spyder Trust (SPY) was topping out in April 2012, the bond pros were buying bonds and selling notes. This is reflected in the NOB spread as it measures the difference, or spread, between T-bonds and T-notes.
The rationale here is that when the economy is thought to be weakening or stocks are perceived as vulnerable, long-term rates will typically fall faster than short-term rates. When the spread is rising, it is generally a negative for stocks and the precarious state of the 30-year T-bond yields was one of the triple alerts for stocks.
The NOB spread now appears to have bottomed and the technical action of two key bond ETFs is also consistent with a further decline in yields.
Chart Analysis: The NOB spread formed higher lows in April 2012 as the SPY was forming higher highs (line 1). Then in early May, its downtrend, line a, was broken and the spread peaked in early June as SPY was bottoming.
- The spread peaked in the middle of November 2012 and started a long-term downtrend, line b.
- This downtrend was broken on March 22 (line 2) and the spread is now in a clear uptrend.
- It would take a drop below last week's lows to weaken this uptrend.
- The NOB spread actually bottomed on March12 when the SPY closed at $155.68.
- For the SPY the first key support is now at Monday's low of $155.10 and then at $153.77 or 1539 in the S&P 500.
The weekly chart of the 10-year T-note yields broke it uptrend, line c, on April 5.
- The break of this uptrend, point 3, suggested that the uptrend in yields from the lows last July might be over.
- Since the trend line break, yields rebounded sharply from a low of 1.69% to a high close last week at 1.805%.
- The yields turned lower last Friday and a break below the April 5 lows will signal lower yields ahead.
- It would take a move in yields above last week's high at 1.805% to indicate that the trend line break might be false.
NEXT PAGE: What to Watch
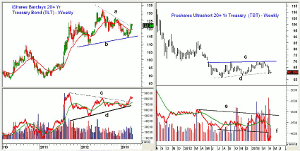
|pagebreak|The weekly chart of the iShares Barclays 20+ Yr Treasury Bond ETF (TLT) shows that it just broke its downtrend, line a, last Friday.
- The next major resistance is in the $125 to $127.19 area.
- A close above these levels will confirm a new uptrend as it would overcome the 61.8% Fibonacci retracement resistance.
- TLT had a low in early March of $114.62 and four weeks later surged above its 20-week EMA.
- The weekly OBV broke through its weekly downtrend five weeks after moving above its WMA.
- The daily OBV (not shown) is also above its WMA so the multiple time frame analysis of the OBV is positive.
- There is initial support now at $121 and then just below $120. The quarterly pivot is at $117.90.
The Proshares Ultrashort 20+ Year Treasury ETF (TBT) is a two times inverse ETF based on the Barclays 20+ Year Bond Index.
- The weekly chart shows that is has been in a trading range since last July when it made a low of $56.23.
- There was a secondary low at $58.63, forming the support (line d) that was slightly violated two weeks ago.
- The range, lines c and d, looks like a continuation pattern or a pause in the downtrend.
- The weekly OBV broke its support three weeks ago as it preceded the price break.
- There is initial resistance at $64.24 with major in the $69.64 area.
- The completion of the trading range has downside targets in the $48-$50 area.
What it Means: It is always important to keep an eye on the bond market as early in the year many thought that yields had formed a major bottom. The technical evidence then, When Will the Fat Lady Sing?, indicated that bond yields were still in their long-term downtrend.
This is still the case and the current action of the NOB spread suggests that yields may test the July lows, which may reflect a distrust of the recent stock market rally.
How to Profit: For the iShares Barclays 20+ Yr Treasury Bond ETF (TLT), go 50% long at $120.24 and 50% long at $119.18, with a stop at $117.23 (risk of approx 2.1%).


