Although this sector has improved lately, it has been fighting headwinds from the tepid global economic growth, and MoneyShow’s Tom Aspray takes a technical look to determine if it’s the materials time to shine.
Stocks again finished the day on a strong note as the early selling was absorbed by the market. Another new closing high for the Dow Industrials this week has yet to be matched by the S&P 500 but may be before the end of the week.
The lower than expected inflation numbers from China boosted the materials sector as did the better than expected earnings after Monday’s close from Alcoa Inc. (AA). Still its stock was just a bit higher as the weekly analysis for AA still looks negative.
Market participants are now debating whether the market correction has already taken place in the transportation and small-cap sectors. This type of rolling correction relies on new industry groups gaining strength while others are correcting.
The Select Sector SPDR Materials (XLB) was up 1.1%, which was significantly stronger that the 0.35% gain in the Spyder Trust (SPY). Another group that came to the forefront was the big tech stocks as Intel Corp. (INTC) was up 3% while Microsoft Corp. (MSFT) was up 3.5%.
Certainly continued strength in the materials and technology sectors could easily push the S&P 500 to the 1600 level. From a technical perspective, the current technical outlook for the Select Sector SPDR Materials (XLB) and two of its industry groups reveals that they are now at critical junctures. There is also one high-yielding chemical stock that appears to have completed its correction.
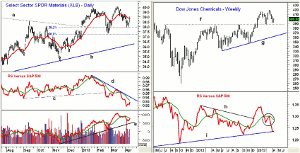
Chart Analysis: The chart of the Select Sector SPDR Materials (XLB) shows that it has bounced from the 38.2% Fibonacci support level at $37.89.
- XLB has closed above its 20-day EMA ands its quarterly pivot at $38.74.
- On a longer-term basis, the downtrend, line a, was broken last December.
- A completion of the recent trading range has upside targets in the $42-$43 area.
- The relative performance has been acting weaker than prices as it broke support in February with XLB acting weaker than the S&P 500.
- The RS line is still below its steep downtrend, line d.
- The daily on-balance volume (OBV) has turned up but is still below its WMA.
- The OBV did confirm the recent highs and shows a long-term uptrend, line e.
- There is next resistance at $39.28-$39.45
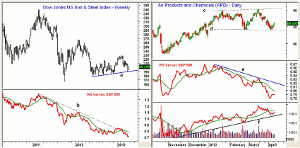
The Dow Jones Chemical Index reveals that it overcame major resistance, line f, in early 2013. The breakout level was tested first in early March as the low was 387.30.
- This past week, the index came close to retesting the breakout level again, and a strong weekly close is needed to improve the technical outlook.
- The breakout was confirmed by the relative performance as it overcame the weekly downtrend, line h.
- The RS line has dropped back to test longer-term support at line i.
- The RS line was weaker than prices at the recent highs (see circle) as it just rebounded back to its WMA.
- A close back above the 410 level would be positive.
NEXT PAGE: The Strength of Steel
|pagebreak|The steel stocks were also strong Tuesday with US Steel (X) up 4.5% and ArcelorMittal (MT) up 4.1%. The weekly chart of the Down Jones Iron & Steel Index tested important support, line a, last week.
- The index peaked at 339.30 and is now down over 40% from its high.
- A move above the most recent high at 216.30 would be a positive sign while the February high at 228.71 needs to be surpassed to complete a major bottom.
- The relative performance broke its long-term downtrend briefly in early 2013 before reversing.
- The RS line is now below its WMA and needs to move above the early 2013 high to complete a bottom.
- A break below the November low at 185.44 would be negative.
Air Products & Chemicals (APD) is a $17.86 billion diversified chemical company that currently yields 3.30%.The daily chart shows a broad trading range, lines c and d.
- APD tested the February lows at $84.06 last week.
- This was a drop of 7% from mid-March highs of $90.34.
- The daily relative performance did not confirm the recent high, line e, and has made lower lows.
- The OBV made significant new highs in March and has now dropped back to its long-term uptrend.
- The OBV has turned up but needs to move above its WMA to turn positive.
- There is initial support now at $85.50-$85.60 and then in the $84 area.
What it Means: The focus on the materials is obviously tied in part to the prospects for China’s growth, but it will also take more than one sector to power another surge in the major averages. Therefore I will be keeping an eye on the tech sector to see if the weekly analysis can turn around.
The risk reward and yield look attractive for APD.
How to Profit: For Air Products & Chemicals (APD), go 50% long at $85.86 and 50% long at $85.36, with a stop at $83.66 (risk of 2.3%).
Portfolio Update: Should be long the Select Sector SPDR Materials (XLB) from $38.46 with a stop at $37.08.


