REITs continued their strong performance following the real estate crash, with the S&P Developed REIT Index rising 15% for the past year as MoneyShow’s Tom Aspray goes prospecting for bargains in this hot sector.
Weak global economic data did not help stocks on Monday and the European markets were mostly closed. The declining stocks led the advancing stocks by a 2-1 margin with industrial and materials stocks being the weakest.
The jump in Eurozone unemployment, so far, is not hurting the Eurozone markets with many up close to 1% in early Tuesday trading. The US futures are also higher in early trading but the major averages need a strong close above the recent highs to signal another sharp rally phase with S&P 500 targets in the 1590-1600 area.
One group of financial stocks that acted well Monday were the REITs as many were stronger than the overall market and their attractive yields have investors interested. The seasonal tendencies for REITs, discussed last week, is to form a secondary low in March and then top in July.
With yields on 10-Year Treasury notes declining to 1.84%, the high-yield REITs are looking even more attractive and these three appear to have completed short-term bottom formations.
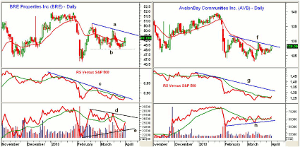
Chart Analysis: BRE Properties Inc. (BRE) is a $3.78 billion residential REIT that currently yields 3.20% with dividends paid quarterly. It concentrates on multi-family apartment communities.
- BRE dropped sharply in early February and hit a low of $46.74 before rebounding sharply.
- The support now in the $48 area, line b, appears to be holding.
- The short-term downtrend, line a, is at $49.80 with more important resistance at $50.84 to $51.71.
- The relative performance has moved above its WMA and is testing its downtrend, line c.
- The volume has picked up over the past two days but the daily OBV is still just below its WMA and resistance at line d.
- The weekly OBV (not shown) is looking much stronger as it is well above its WMA.
- There is initial support now at $48.06-$49 with stronger at $47.38.
AvalonBay Communities Inc. (AVB) is a $14.65 billion residential REIT that concentrates on multi-family communities in ten states and the District of Columbia. It currently yields 3.40%.
- AVB hit a low in March of $123.04 but has been in a tight range for the past three weeks.
- The daily downtrend, line f, is now being tested with the quarterly pivot at $130.21.
- There is further resistance at $133.61 with the January high at $139.51.
- The daily relative performance has moved back above its WMA with stronger resistance at the downtrend, line g.
- The daily OBV has formed higher lows, line h, and is back above its WMA.
- There is first support now at $126.50 and then stronger in the $123-$124.50 area.
NEXT PAGE: One More Promising REIT
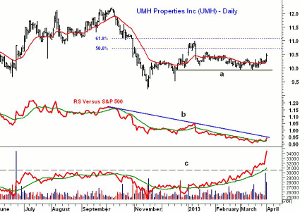
|pagebreak|UMH Properties Inc. (UMH) is a $183 million diversified REIT that focuses on manufactured-home communities. It trades 44K per day normally but has shown heavy volume in the past two days. It currently yields 7.0%.
- UMH had a high in September of $12.20 and the 38.2% Fibonacci retracement resistance is at $10.72.
- The 61.8% retracement resistance is at $11.07.
- The daily relative performance shows an apparent bottom formation and a move through resistance at line b, will confirm.
- The daily OBV broke through major resistance, line c, in the middle of March and has surged over the past few days with the heavy volume.
- The daily chart has minor support at $10.20-$10.40 with more important support at $9.94, line a.
What it Means: Monday’s action in the REITS, I think, is a positive sign for the group and all three of these have attractive yields. UMH is by far the highest and therefore the riskiest.
If they break out to new highs for the year, I would cancel the buy orders as I do not want to buy them if that occurs.
How to Profit: For BRE Properties Inc. (BRE), go 50% at $48.88 and 50% at $48.56, with a stop at $47.17 (risk of approx. 3.2%).
For AvalonBay Communities Inc. (AVB), go 50% at $127.42 and 50% at $126.56, with a stop at $122.53 (risk of approx. 3.5%).
For UMH Properties, Inc. (UMH), go 50% at $10.38 and 50% at $10.24, with a stop at $9.87 (risk of approx. 4.3%).
NEXT PAGE: The Charts in Play Portfolio
|pagebreak|


