Crude oil rallied after the S&P/Case Shiller index showed the largest annual increase in single-family home prices in six years, and MoneyShow’s Tom Aspray looks at potential candidates for the market’s next leg up.
Stocks shrugged off a drop in consumer sentiment and rumors from the Eurozone to put in a strong performance Tuesday suggesting prices may be ready to break out of their recent trading range.
The market internals were strong Tuesday with advancing stocks beating decliners by a 2.3 margin. Another day of positive market internals and a higher close is needed to signal a move in the Spyder Trust (SPY) to the $159-$150 area and the Dow Industrials to 15,000. The futures are lower in early trading, so watch the close.
Crude oil was strong Tuesday and it has a strong seasonal tendency to bottom in February. Since the start of the year the SPDR S&P Oil and Gas Exploration ETF (XOP) has outperformed the Spyder Trust (SPY) by over 6% as it is up 15.7%.
Many of the energy stocks have turned up after testing support, and they look poised to break out on the next rally. Even though we have several positions in this sector, it seems to offer the best potential in the current market.
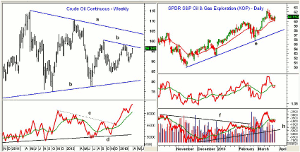
Chart Analysis: Crude oil has been strong, so far, this week and a breakout above the resistance at line b has first targets above $100-$100.42 per barrel, which was the September 2012 high.
- The longer-term resistance is now at $104.50 with the early 2012 high at $110.55.
- The weekly OBV broke its year-long downtrend, line c, in December.
- The OBV held well above its rising WMA on the correction from the February high at $98.24.
- There is minor support at $95 with further in the $93.50-$94 area.
SPDR S&P Oil and Gas Exploration ETF (XOP) hit a high of $62.66 in the middle of March and recently had a low of $59.93, which was a 4.4% pullback from the highs.
- XOP is testing its 20-day EMA with further support from February at $59.90-$59.60.
- There is stronger support in the $58-$58.40 area.
- The daily relative performance did confirm the recent high and has turned up after correcting to just below its WMA.
- The daily OBV broke through its downtrend, line f, in late February.
- The OBV then pulled back to retest its WMA before surging to new highs.
- Once above the recent highs at $62.66, the next upside targets are in the $65.58-$65.76, which were the 2011 highs.
NEXT PAGE: 2 Stocks to Buy
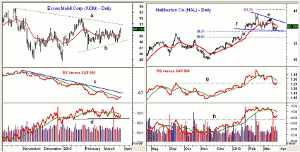
|pagebreak|Exxon Mobil Corp. (XOM) was recommended early in the month as one of The Most Oversold Dow Stocks and has stayed in a narrow range for most of the month. It currently yields 2.6%.
- XOM has rallied from a low of $87.90 over just a few days.
- The trend line resistance, line a, is now at $90.60 with the January high at $91.93.
- The relative performance has just moved above its WMA but is still well below its downtrend, line c.
- The on-balance volume (OBV) has reached support at line d and has now turned higher.
- It needs to move above its WMA to confirm that the correction is over.
- The October high was $93.67 with the 2008 high at $96.12.
Halliburton Co. (HAL) has formed a flag formation, lines e and f, since the February 14 high at $43.96.
- The correction has tested the 38.2% Fibonacci support from the November lows, which is at $38.52.
- The monthly pivot support for April is at $38.43 with the 50% retracement support at $36.85.
- The relative performance has dropped back to test its breakout level (line g) after confirming the recent highs.
- The daily OBV is also retesting its breakout level at line h.
- The daily downtrend is at $42.10 with further resistance at $42.64.
- The 127.2% Fibonacci projection target is at $45.37.
What it Means: The completion of the trading range in the stock market has not been confirmed by all the market averages or technical studies. It could be this week, but it is also possible that we will move sideways to lower for a bit longer.
I recommended several stocks in the energy sector earlier in the month, and it still seems most likely to lead the next market rally and now looks attractive for new buying.
How to Profit: For the SPDR S&P Oil and Gas Exploration ETF (XOP), go 50% long at $60.24 and 50% long at $59.48, with a stop at $57.25 (risk of approx 4.3%).
For Exxon Mobil Corp. (XOM), go 50% long at $89.66 with a stop at $86.86.
For Halliburton Co. (HAL), go 50% long at $39.72 and 50% long at $38.62, with a stop at $36.92 (risk of approx. 5.6%).
Portfolio Update: Should be 50% long Exxon Mobil Corp. (XOM) at $88.66 with a stop at $84.19. Cancel the order to add at $87.82.


