Confirming Dow Theory, the Transports notched all-time highs along with the Industrials this year, and MoneyShow’s Tom Aspray examines the charts for buy candidates in this red-hot sector.
The focus Wednesday was on the ninth positive close in a row for the Dow Industrials even though it was only up 0.04%. The S&P wasn’t much better as it was only up 0.13% and both lagged badly behind the Dow Transportation Average as it gained 1.63%.
So far in 2013, the Transports are up over 17% versus just over a 10% gain in the Dow Industrials and 9% in the S&P 500. Of course, in 2012, the Industrials were up just over 7%, only 1.5% better than the Transports, but both badly lagged the 13.4% gain in the S&P 500.
The Transports are made up of five primary industry groups. The iShares Dow Jones Transportation Index (IYT) is up 28.3% since the November 16 low, but the Dow Jones Airlines Index (DJUSAR) is up a whopping 57.4%. The railroads were the second best performing industry group, up 25.7%, followed by the transportation services. The Dow Jones Trucking Index (DJUSTK) has been weakest as it is up only 14.2%.
From a seasonal perspective, the Transports typically form an interim bottom at the end of March and then rally into early May. The Trucking group typically forms a major low in October, with a minor low in early March, leading to a final high in early May. A technical examination of the key industry groups in the transportation sector will help develop a strategy for adding further positions in this hot sector.
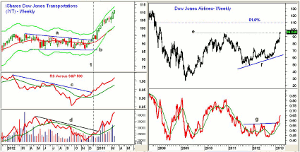
Chart Analysis: The weekly chart of the iShares Dow Jones Transportations (IYT) shows the breakout of the year-long trading range, lines a and b, late last year.
- After the breakout in December (line 1) there was a retest at the end of the month before it accelerated to the upside in 2013.
- The relative performance moved above its WMA in October and broke its downtrend, line c, in December.
- The OBV moved through its WMA in December, but did not break its downtrend until early 2013.
- IYT had a five-day pullback in February before again accelerating to the upside.
- There is first support for IYT at $107-$108.40 with the monthly pivot at $105.88.
The Dow Jones Airlines Index (DJUSAR) has just moved above the October 2010 high with the major 61.8% Fibonacci retracement resistance from the 2007 high at 164.41 now at 110.
- This retracement resistance level is over 14% above current levels.
- The weekly relative performance moved above its WMA in early November.
- The major resistance (line g) was overcome at the end of January, which completed the major bottom formation.
- There is first meaningful support now in the 80-85 area, which includes the sharply rising 20-week EMA.
- The daily studies (not shown) are strong and show no signs yet of a top.
- One of the lagging airline stocks is Chile’s LAN Airlines S.A. (LFL), but it shows no signs yet of a bottom.
NEXT PAGE: Bullish Signs for 2013
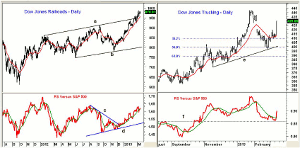
|pagebreak|The Dow Jones Railroad Index (DJUSRR) convincingly broke through its upper trading channel, line a, in the past week.
- The upside target from the trading range, lines a and b, is in the 1080-1100 area.
- The relative performance formed higher lows last fall, line d.
- The downtrend in the relative performance, line c, was broken in December.
- The daily chart of the RS line shows a solid uptrend as it has pulled back several times to test its WMA.
- There is initial support now in the 950 area with more important in the 900-920 area.
- Kansas City Southern (KSU) was added to the portfolio in early January.
The Dow Jones Trucking Index (DJUSTK) was very strong Wednesday as it was up 3.7%. The index peaked at 442.21 in the latter part of January.
- The correction from the highs briefly violated the 50% Fibonacci retracement support at 399 as the low was 398.27.
- The 61.8% support is at 389 with further chart support at 380-385.
- The daily relative performance turned higher last September and then moved convincingly above resistance, line f, at the end of the month.
- The RS line confirmed the highs in late January and dropped back to test the support at line f.
- The strong close has taken the RS line back above its WMA indicating that the correction is clearly likely over, though one more pullback is possible.
- Landstar Systems (LSTR) and Old Dominion Freight Line Inc. (ODFL) are two trucking stocks I am watching.
What it Means: As I noted yesterday, our buy level in JetBlue Airways (JBLU) was just missed by a penny before it accelerated to the upside. I think that the action of the Transports so far in 2013 is a bullish sign for the entire year.
The daily studies are still positive, though the number of new highs on the NYSE is not confirming the price action. Nevertheless, I am still expecting the last half of the month to be much choppier than the first half.
This could provide some new opportunities to buy stocks in the Transportation sector.
How to Profit: No new recommendations at this time.


