As the tech sector rallied, propelled by the strong broad market surge, MoneyShow’s Tom Aspray goes shopping for good buys in this previously lagging sector.
New record highs for the Dow Industrials made front page news. The new highs were not surprising as the NYSE Advance/Decline moved to new highs in December, Stuff Those Stockings with Stocks, and has continued to act stronger than prices.
Of course, since the end of 2012 lows the market has already had impressive gains, and I expect that the Spyder Trust (SPY) will eventually move above the all-time highs at $157.42. The SPY is already up 8.3% for the year and would be up 10.7% on a test of the all-time highs.
This double-digit gain for the year makes the focus on risk even more important. Therefore, one needs to look at those stocks that have a long-term positive technical outlook and have pulled back to good support where the risk can be reasonably controlled.
The Nasdaq 100 came to life yesterday as the PowerShares QQQ Trust (QQQ) gapped higher and closed above key resistance. This action was confirmed by the Nasdaq 100 Advance/Decline suggesting that this lagging sector may finally be ready to catch up. Exposure to the tech sector is now warranted with a tech-focused ETF or these three tech stocks that appear to have completed their corrections.
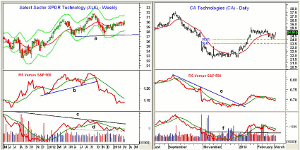
Chart Analysis: The Select Sector SPDR Technology (XLK) has traded in a $1.15 range so far in 2013. Every week in 2013, XLK has closed above the 20-week EMA, which is now at $29.50.
- XLK made new highs for the year on Tuesday with the weekly starc+ band now at $31.28.
- The September 2012 high was $31.74 and a decisive close above this level would project a move to the $34-$35 area.
- The weekly studies are still negative while the daily indicators (not shown) turned positive on Tuesday.
- The weekly relative performance broke support (line b) last fall and is still below its declining WMA.
- The weekly OBV is trying to turn up from its WMA and could close back above its WMA this week.
- Initial support in the $30 area with the quarterly pivot at $29.41 with the 50% Fibonacci retracement support at $28.71.
CA Technologies (CA) is an $11.36 billion dollar software company and it currently yields 4.10%.
- CA made a high in January at $25.57 with a low last week of $23.98.
- This was just below the minor 38.2% Fibonacci support at $24.06.
- The 50% support is at $23.60 with the quarterly pivot at $23.33.
- The daily relative performance broke its downtrend, line e, in January but has been recently correcting.
- The weekly RS line (not shown) is now just testing its WMA.
- The OBV completed is bottom by moving through resistance at line f and is now trying to complete its correction.
- On a move above the recent highs, there is stronger resistance at $27.34-$27.58 from the latter part of 2012.
NEXT PAGE: 2 Stocks Ready to Move
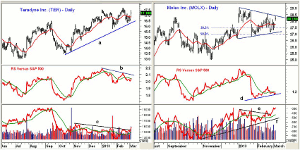
|pagebreak|Teradyne Inc. (TER) is a $3.91 billion dollar semiconductor equipment and materials company that peaked at $17.66 before a two-week pullback to its uptrend, line a.
- There is initial support now at $16.60-$17 with more important at $16 as the quarterly pivot is at $16.10.
- The low for the year has been $15.75.
- The daily relative performance just closed back above its WMA but is still below its downtrend, line b.
- The on-balance volume (OBV) broke through its downtrend, line c, on Tuesday as volume was double the average.
- The weekly OBV (not shown) has already broken through major resistance.
- The completion of the weekly triangle formation has upside targets in the $22-$24 area.
Molex Inc. (MOLX) is a $5 billion diversified electronics company that currently yields 3.2%. It has a healthy current ratio of 2.4.
- MOLX peaked on January 3 at $29 and had a low later in the month at $26.77.
- This was just below the 50% Fibonacci retracement support at $26.99 with the 61.8% support at $26.53.
- There is quarterly pivot line support at $27.36.
- The daily chart shows a flag formation, which is a typical continuation pattern.
- The Fibonacci target from this flag is at $29.60 while a completion of the long-term trading range has targets in the $34-$36 area.
- The daily relative performance is in a short-term uptrend, line d, but is still below its WMA.
- The daily OBV broke through resistance at line e last month and has reconfirmed the breakout this week as it has rallied sharply.
- There is initial support now at $27.70-$28 with further at $27.36 and at the quarterly pivot.
What it Means: Now that stocks are really getting both investors’ and the professionals’ attention, I think the focus will turn to the technology sector. Even though the sectors have not given any strong buy signals yet, these three stocks do look ready to move.
Longs in XLK are also recommended as quite tight stops can be used and once Apple Inc. (AAPL) bottoms, it could really take off.
How to Profit: For Select Sector SPDR Technology (XLK), go 50% long at $30.03 or better and 50% long at $29.66, with a stop at $28.58 (risk of approx. 4%).
For CA Technologies (CA), go 50% long at $24.70 or better and 50% long at $24.33 with a stop at $23.13 (risk of approx. 5.6%).
For Molex Inc. (MOLX), go 50% long at $28.12 or better and 50% long at $27.76, with a stop at $26.42 (risk of approx. 5.4%).
For Teradyne Inc. (TER), go 50% long at $17.06 or better and 50% long at $16.73, with a stop at $15.94 (risk of approx. 5.6%).


