Large-cap stocks have been out of favor in 2013, thus taking some of the big name Dow Industrial stocks back to more important support. Moneyshow’s Tom Aspray’s analysis of the ten most oversold Dow stocks has identified some interesting opportunities.
The Dow Industrials performed the best last week gaining 0.6% and also beat the S&P 500 in February. Stocks are lower early Monday with the Dow futures losing about 40 points. The selling started in Asia as efforts by China to dampen real estate speculation caught the market by surprise.
After last week’s close, my review of the technical evidence suggested that we could see more choppy and volatile trading before the intermediate-term uptrend resumes. Of course, many individual stocks had nice gains in the past month even though the market was correcting. Verizon Communications (VZ) was up close 7% in February while the Spyder Trust (SPY) was up just over 1%.
In my monthly starc band analysis of the Dow stocks, several interesting stocks turned up. This scan determines which of the Dow stocks are closest to their monthly starc bands. Those nearest the starc+ bands are the most overbought while those closest to the starc- bands are the most oversold. Of course, this is just one measure of whether a stock or ETF is overbought or oversold.
However, I have found that combining this scan with the monthly analysis of the chart, relative performance, and on-balance volume can be quite effective in identifying good buying opportunities. At the top of the list is Wal-Mart Stores Inc. (WMT) as it is just 10.9% above its monthly starc- band.
Two of the other Dow stocks on the list International Business Machines (IBM) and McDonald's Corporation (MCD) were discussed last Monday. The four Dow stocks I will focus on today either offer attractive new opportunities or provide some good technical insight that may help you in the future.
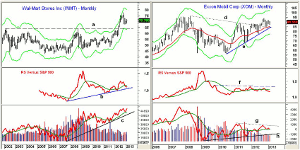
Chart Analysis: Wal-Mart Stores Inc. (WMT) has rallied nicely from the February low of $68.13 and closed last Friday back above the quarterly pivot at $71.40 while the monthly pivot is at $70.29.
From July through October 2012, WMT came very close to its monthly starc+ band several times before dropping down to the 38.2% Fibonacci support.
- The ten-year resistance at $64.20 was overcome in March 2012, which was a very bullish sign.
- The next resistance is at $75-$77.60 with the monthly starc+ band at $80.19.
- The width of the ten-year trading range has upside targets in the $84-$88 area.
- The relative performance has dropped below its WMA but is still holding well above its uptrend, line b.
- The monthly OBV closed February very close to new highs as it tested its rising WMA on the correction.
- There is minor support in the $69.70-$70.58 area.
Exxon Mobil Corp. (XOM) broke through its downtrend, line d, that connected the 2008 and 2011 highs. The breakout level was retested last November and December.
- There is monthly resistance now at $91.93-$93.67 with the monthly starc+ band at $101.87.
- The RS line has been below its WMA since the end of November.
- The relative performance needs to move through the multi-year resistance at line f, to confirm it is leading the market higher.
- The monthly OBV is testing its WMA as it has been in a narrow range for the past three months.
- A move in the OBV above its resistance at line g, would be a very bullish sign.
- There is first good support at $88.73 -$87.94 with monthly support at $84.70.
NEXT PAGE: 2 More Attractive Dow Stocks
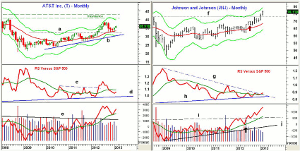
|pagebreak|AT&T Inc. (T) dropped back to test its 38.2% Fibonacci support and its still rising 20-week EMA several times from October 2012 through January 2013.
- There is monthly resistance at $37.64 to $38.58 with the monthly starc+ band at $39.93.
- There is a band of longer-term resistance at $40.77 to $43.12, which goes back to the 2007-2008 highs.
- The relative performance completed its bottom formation in May 2012 as resistance at line c, was overcome.
- The RS line is below its WMA but above long-term support at line d.
- The monthly on-balance volume (OBV) broke out to the upside in early 2012 and turned up from it rising WMA in December.
- There is initial support at $35.20-$35.80 and then at $34-$34.50.
Johnson and Johnson (JNJ) has been acting very well over the past six months, as after the August 2012 low of $66.85 (see arrow), it has made a series of higher monthly lows.
- At the end of January, it broke through resistance at $72.76 (line f) that goes back to the 2007 highs.
- The monthly starc+ band is at $79.04 with chart targets in the $86-$88 area.
- The relative performance has just broken its downtrend, line g, as it has moved slightly above its WMA.
- The OBV dropped back to test its rising WMA in May 2012, which was a good example of a bullish setup I discussed in my recent trading lesson.
- There is minor support at $75.40 with the 38.2% Fibonacci retracement support at $74.03.
- The more important 50% Fibonacci support is at $73.11.
What it Means: The improvement in the relative performance analysis on the SPDR Dow Jones Industrial Trust (DIA) suggests that the big-cap stocks are starting to lead the market higher. Of these four, AT&T Inc. (T) looks the best for all investors and also yields 5%. The long-term outlook for Exxon Mobil Corp. (XOM) is positive but it needs a strong close this week to turn the indicators more positive.
Johnson and Johnson (JNJ) is a good example of what happens when you are too conservative in your buy levels. I have made multiple recommendations over the past three months but would still not chase it as a one-two month correction is likely this year.
How to Profit: For AT&T Inc. (T), go 50% long at $35.84 and 50% long at $35.36, with a stop at $33.79 (risk of approx. 5%).
For Exxon Mobil Corp. (XOM), go 50% long at $88.66 and 50% long at $87.82, with a stop at $84.19 (risk of approx. 4.5%).
Portfolio Update: Per last month’s article, should be 50% long Wal-Mart Stores Inc. (WMT) at $68.34 and 50% long at $67.72. Use a stop at $67.82.
For International Business Machines (IBM), per the Feb. 4 column, should be 50% long at $198.16 (the 2/21 low was $198.11) and added 50% long last week at $200.44 or better. Use a stop at $194.55.
For McDonald's Corporation (MCD), go 50% long at $94.72 and 50% long at $94.04. Use a stop at $90.44 (risk of 4.1%).


