Traders often use intermarket analysis to gain perspective on various correlated markets, and MoneyShow’s Tom Aspray shows how he watches crude oil to glean clues on the stock market’s future direction, as well as providing some specific levels to watch.
Even though the US market opened lower Thursday in line with weak European markets, once again stocks battled back as the S&P 500 closed slightly higher on the day. The market internals were flat for the day but the A/D lines are still in clear uptrends.
The stock market’s ability to absorb the recent selling is a positive sign but the market needs to accelerate to the upside to stop out the remaining market bears. The daily volume analysis on the Spyder Trust (SPY), as well as the S&P futures is still positive and does not show any signs of a market top.
Crude oil is a market I watch closely for hints of a turn in the stock market as it will often top out or bottom out ahead of stocks. Many times crude oil will break through support or resistance days, or even weeks, ahead of the Spyder Trust (SPY).
A review of the crude oil market and two leading energy ETFs can identify the key levels that if overcome may signal the next significant move in the stock market.
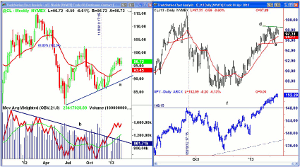
Chart Analysis: The weekly chart of the crude oil futures shows the high in early March 2012 above $115 and the subsequent drop to a low of $80 in June.
- The rebound from this low briefly overcame the 61.8% Fibonacci retracement resistance in the middle of September.
- This high corresponded with the high in the S&P 500 as crude then dropped about $17 per barrel.
- Crude oil has not made a high for several weeks but the weekly on-balance volume (OBV) continues to act well as it is well above its rising WMA.
- The weekly OBV moved above its WMA on November 23 and four weeks later surpassed the downtrend (line b).
- The daily OBV (not shown) peaked with prices in early February and was much lower on the highs this week.
The daily chart of the April crude oil contract reveals that on September 19, 2012, it dropped below its support at line c. Over the next four weeks crude developed a broad trading range as the Spyder Trust (SPY) completed its top.
- Crude oil bottomed in the middle of November and then retested the lows at the end of December while the SPY held well above its lows.
- Both crude oil and SPY broke out in early January and rallied together until early February.
- The April contract now shows key resistance at $98.73 (line d) and a close above this level will project a move to the $102 level.
- The key support now stands at $95.33 and a daily close below this level, especially on high volume will complete a double top formation.
- The downside targets from the formation are in the $91.80-$92.20 area.
- The daily chart of SPY shows that there is good chart support from the September highs, line f, at $148.15
NEXT PAGE: Positive Signs for Energy Sector
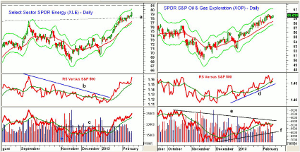
|pagebreak|The daily chart of the Select Sector SPDR Energy (XLE) shows that it closed strong on Thursday, up 0.86%. So far in 2013, it is up 11.1% versus just a 6.9% gain in the Spyder Trust (SPY).
- The daily starc+ band is at $60.07 with the weekly at $81.07, which corresponds nicely to the 2011 high at $80.97.
- XLE has been trading above and below the 2012 highs (line a) for the past few weeks.
- The daily relative performance broke through its downtrend, line b, on January 16.
- The December highs in the RS line were overcome a few days later signaling it was a now market leading sector.
- The RS line has turned up sharply which is a positive sign.
- The OBV also completed its bottom in January as resistance at line c, was overcome.
- The volume has been lower for the past five days but the OBV is still rising.
- There is initial support now at $78 but it would take a drop below $77 to signal a deeper correction.
- More important support in the $73.50-$75 area.
The SPDR S&P Oil & Gas Exploration (XOP) is more diversified than XLE as it has 74 holdings versus just 45 in XLE. So far in 2013, it is up 9.3% and has been weaker than XLE.
- XOP was up Thursday but is still below the recent high at $59.90.
- The daily starc+ band is at $61.09 with the weekly starc+ band at $62.89.
- The daily relative performance has turned up and is still in a solid uptrend, line d.
- The daily OBV is lagging the price action as it is still below its downtrend, line e. It is close to moving back above its WMA.
- The weekly studies (not shown) are positive
- The 20-day EMA is now at $58.38 with more important support in the $56.80-$57.25 area.
What it Means: In my January 17 column Will This Be February's Hot Sector?, I focused on the strong seasonal tendency of crude oil to form a secondary low in early February and rising through August. The positive daily signals favored buying both the energy ETFs, as well as energy stocks, but unfortunately neither XLE nor XOP had enough of a pullback to reach the buy levels. I would keep an eye out for either an up or downside break in the April crude oil contract.
Though there are no signs yet of a top, I would not chase either ETF at this time as the risk at current levels, I think, is too high. There are four energy stocks in the portfolio, which are updated below.
How to Profit: No new recommendation
Portfolio Update: Should be still long Valero Energy Corp. (VLO) from $29.27 as sold 1/3 of the remaining position at $47.44 on February 14. Use a stop at $42.90.
Pioneer Natural Resources (PXD) had a wild day Thursday in reaction to its earnings as it opened $8 lower then rebounded to new highs at $133.68. Should be long from $104.85 and sold half at $131.96 or better on February 14. Use a stop now at $115.84.
Should be 50% long Williams Companies Inc. (WMB) at $32.10. There are some signs of a short-term top. Use a stop at $33.78 and sell ½ at $35.40 or better.
For Stone Energy Corp. (SGY), it has not done much yet, but Thursday’s action was encouraging. It needs a close above $23.40 for an upside breakout. Should be long at $21.96 and would use a stop now at $21.75, which is just under the quarterly pivot.
Editor’s Note: If you’d like to learn more about technical analysis, attend Tom Aspray’s workshop at The Trader’s Expo New York, February 17-19. You can sign up here, it’s free.


